
Campaign Reports
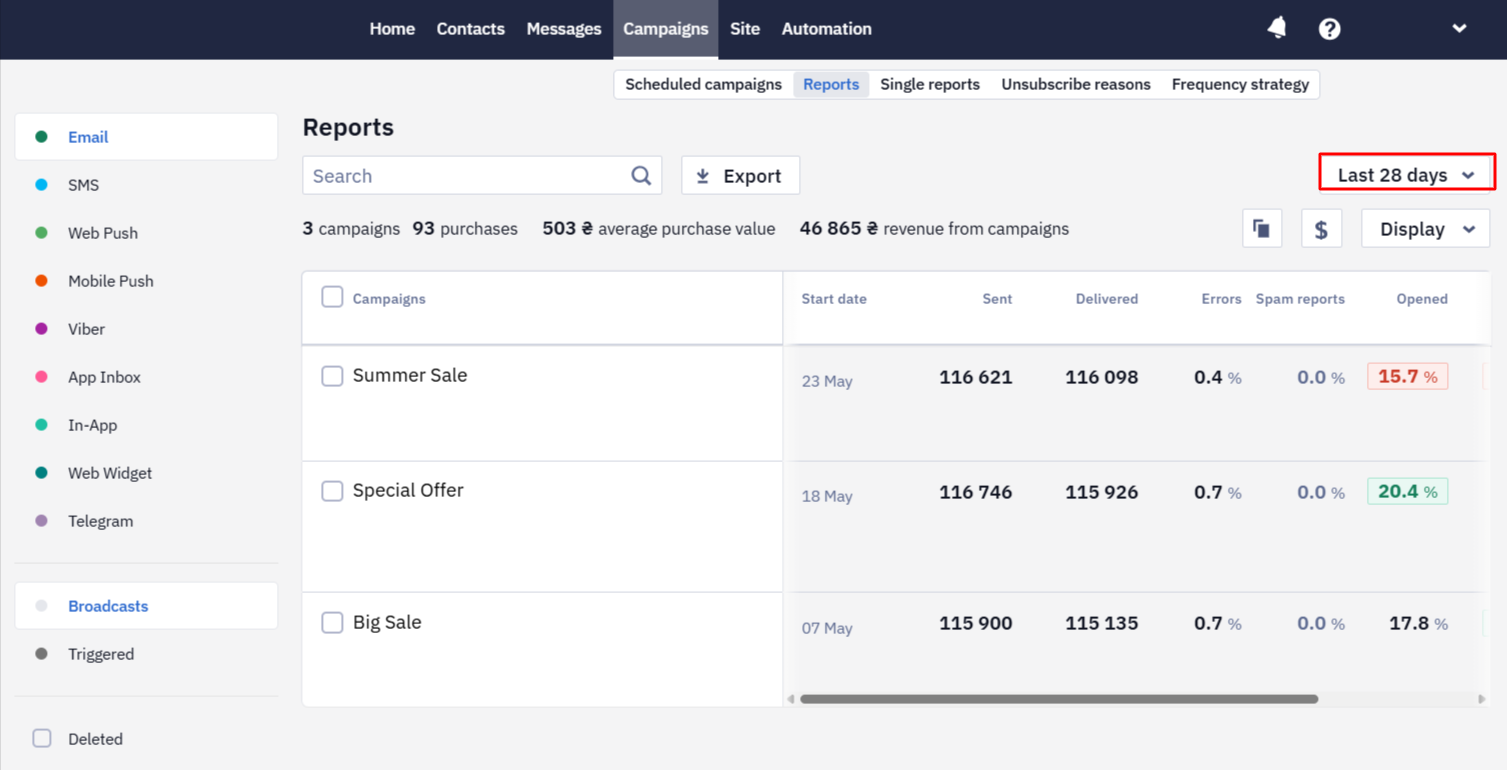
Reports provide statistical campaign information and are available in the Campaigns → Reports section.
Reports display a table of all your campaigns with their respective statuses, the number of contacts who participated in them, and the effectiveness of each campaign.
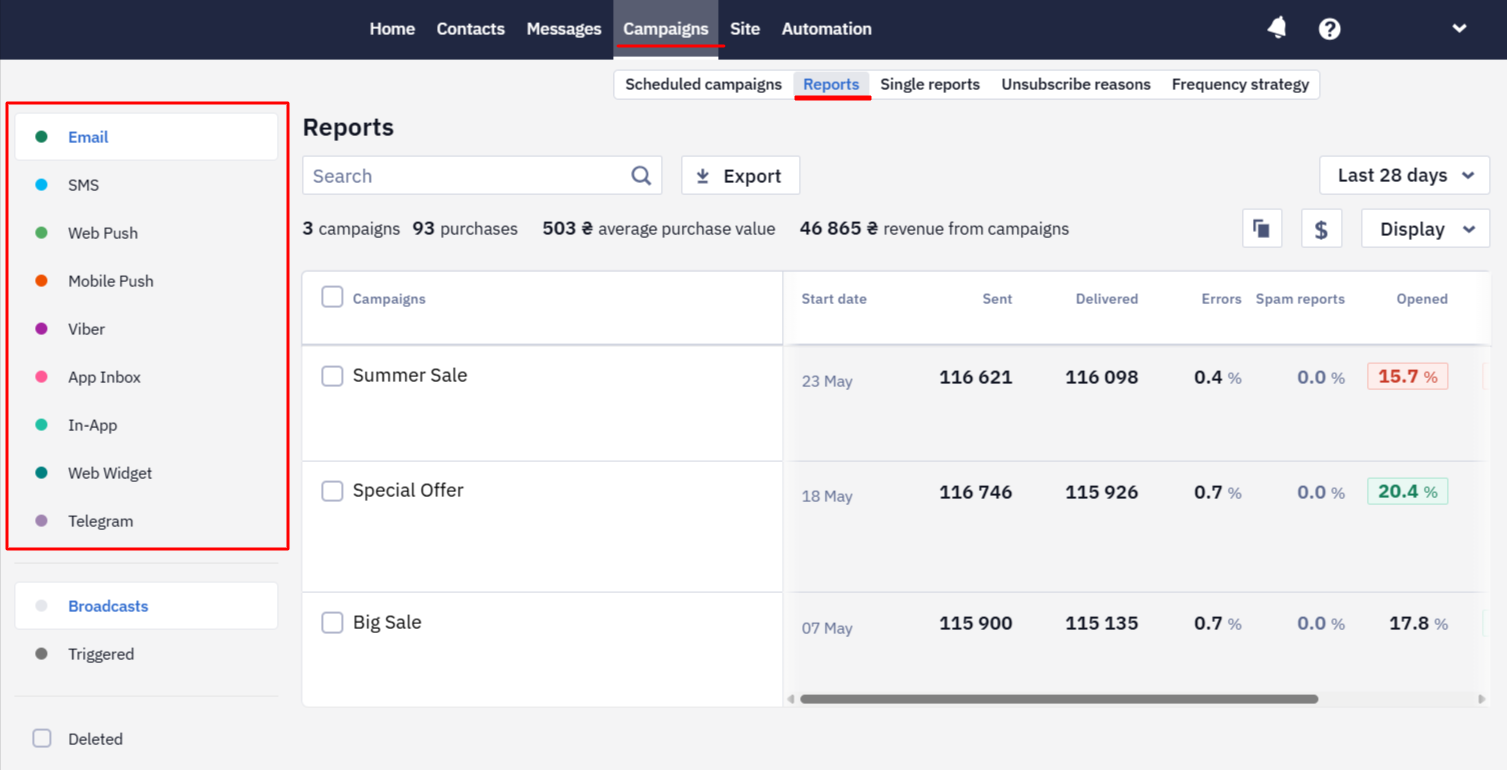
Reports are available for the following media channels:
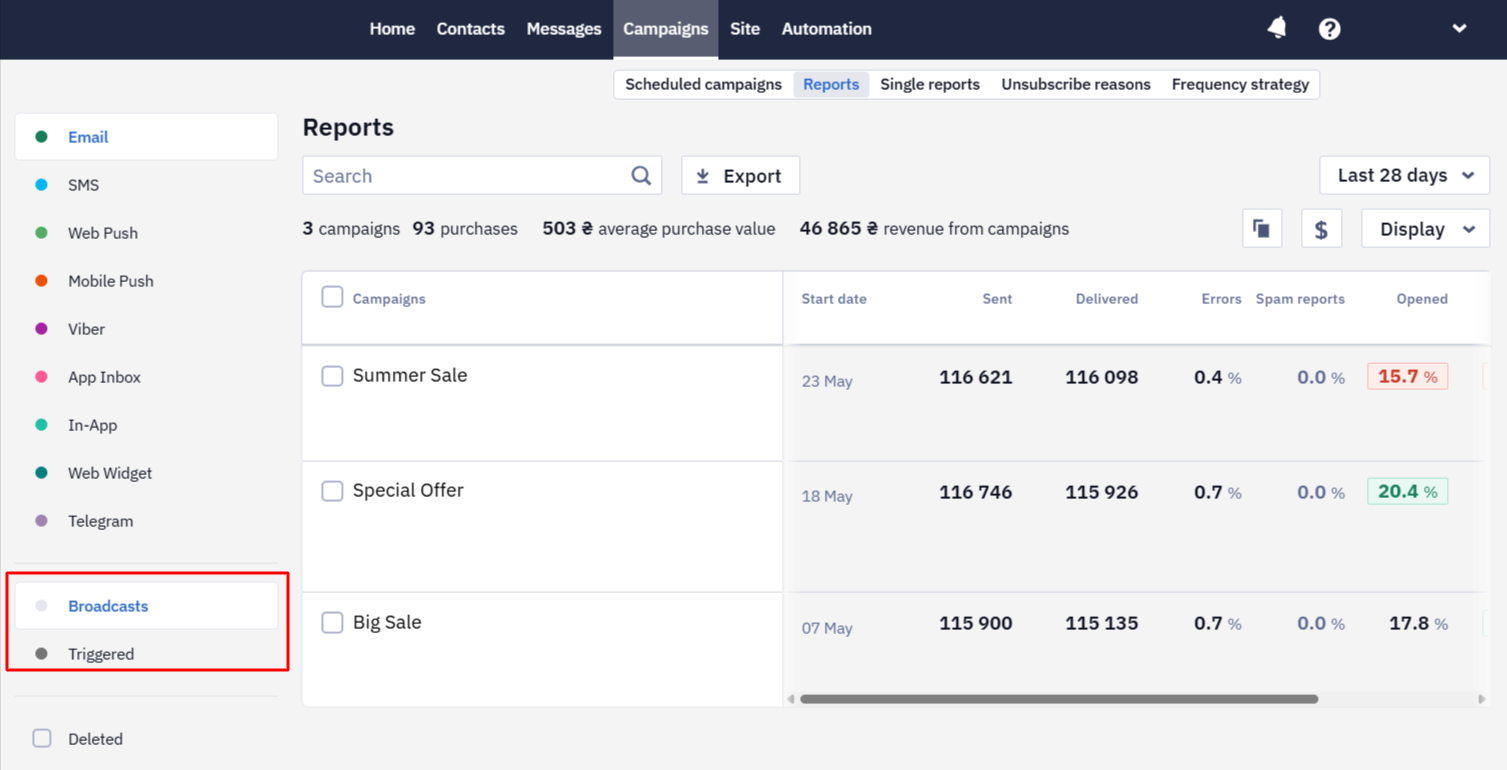
Broadcasts & Triggered Campaigns
There are 2 types of campaigns depending on the sending way:
- Broadcasts — one-time sending of one message to a group of contacts. For example, promo or newsletters.
- Triggered — automatic campaigns based on specific actions of the contact, such as subscription, purchase, review, and so on.
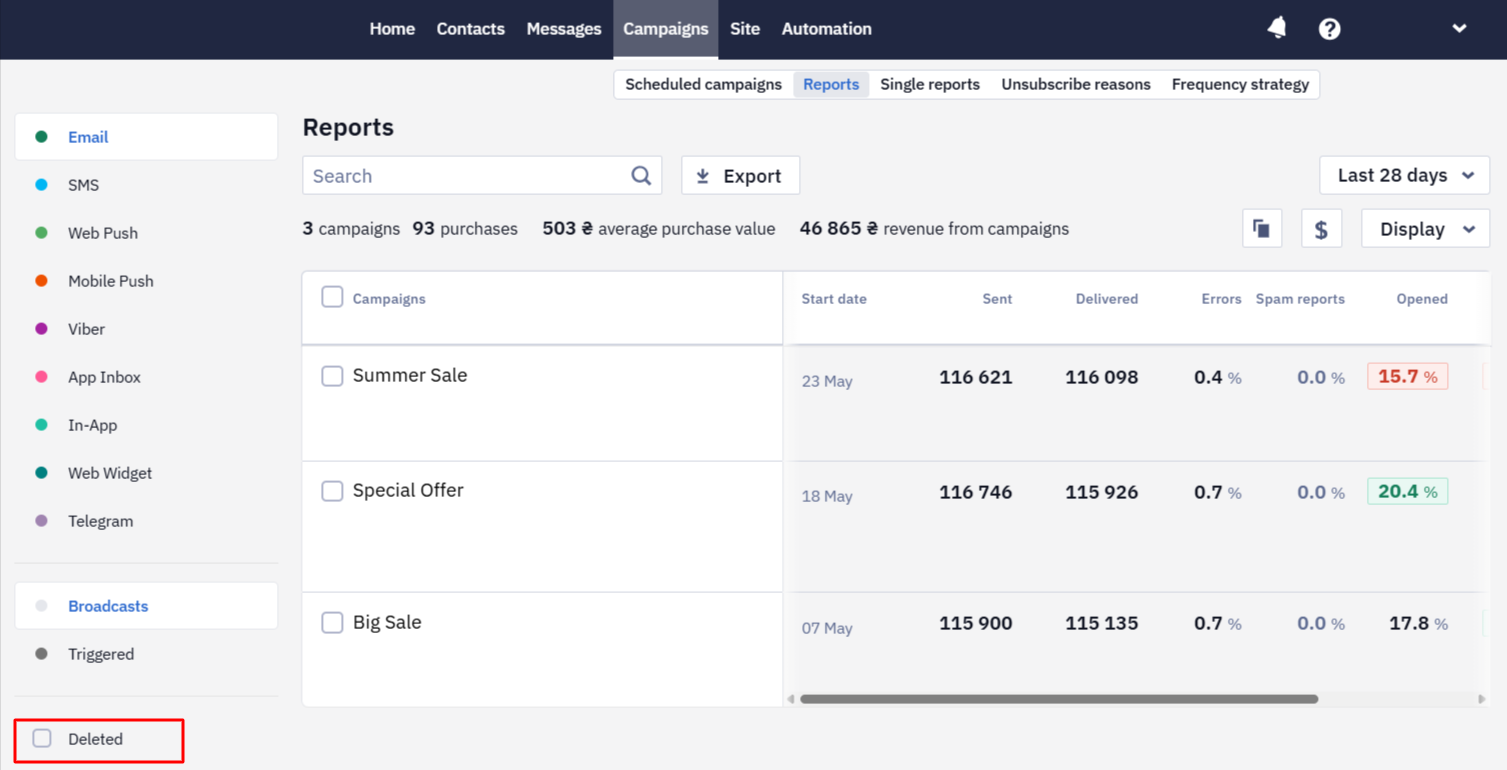
Activate the checkbox in the Deleted field to view deleted campaigns.
Managing Broadcast and Triggered Reports
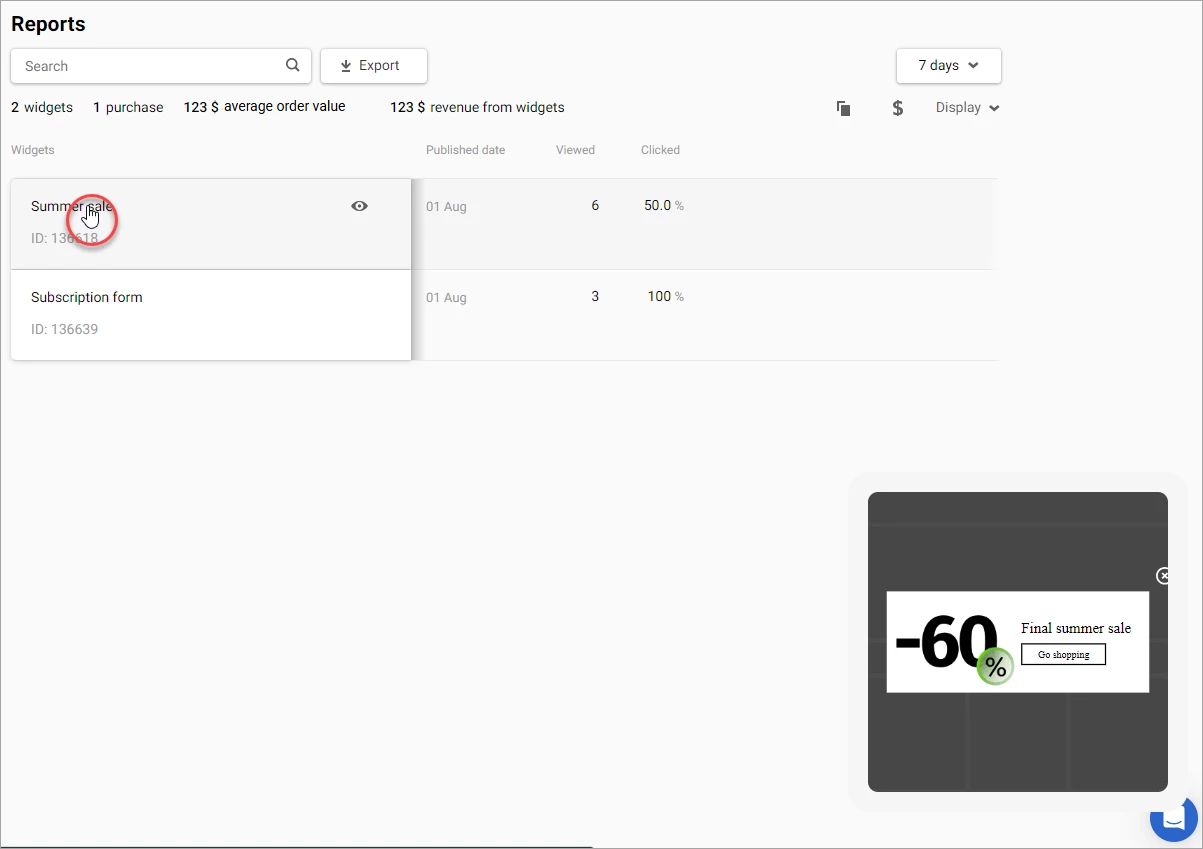
Using Message and Widget Preview
To see the message and widget preview in the bottom right-hand side corner, point to the widget or message name in the Reports column.
Filtering Reports
Reports are displayed as a list and automatically sorted by the start date of the campaigns — the newest ones appear at the top. If needed, you can set a custom period or use one of the preset intervals.
Searching Reports
To search for a report in the general list, insert one of the following parameters into the search bar after selecting the media channel and campaign type:
- Campaign name
- Tag (if added)
- Campaign ID
- Message ID
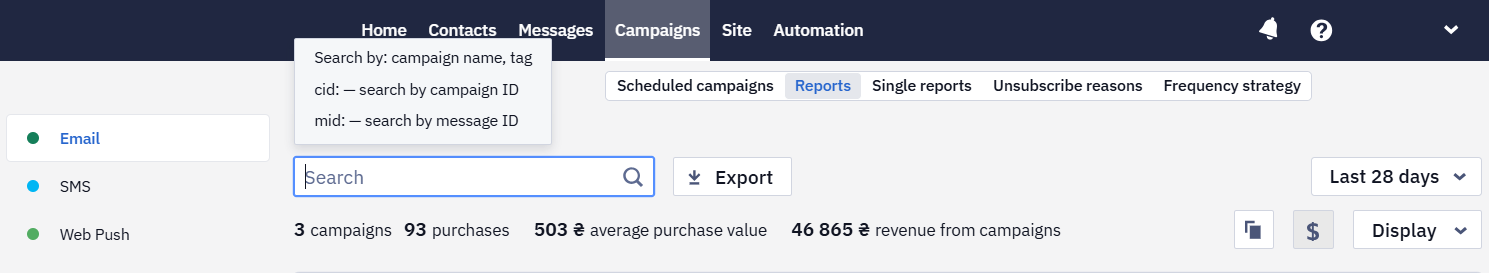
NoteTo search using an ID, precede it with the appropriate search operator:
- cid: before the campaign ID
- mid: before the message ID
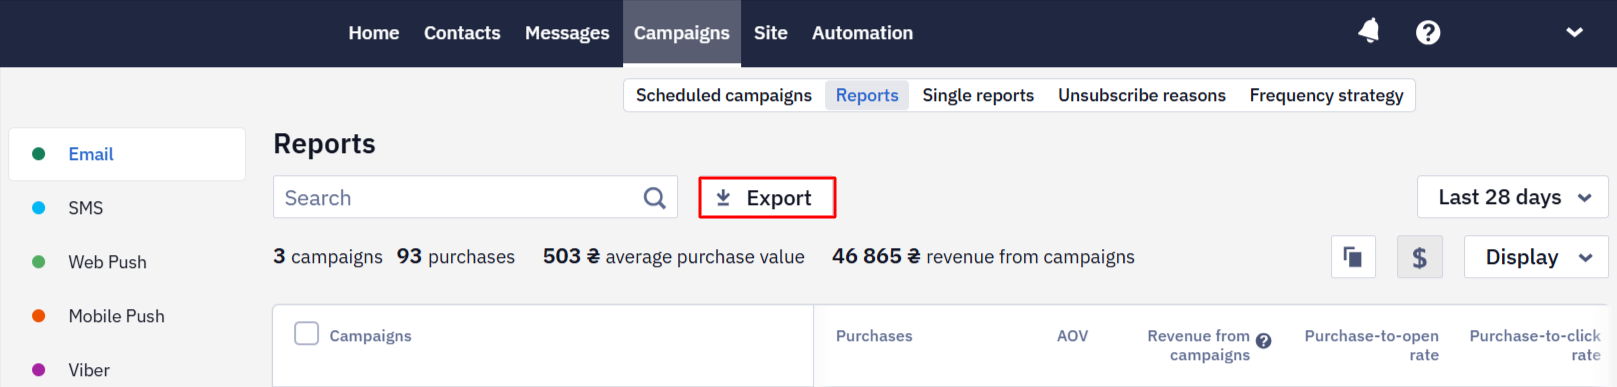
Exporting Reports
To export statistics on selected campaigns into a separate CSV file, click the Export button. The file will contain data for the selected media channel for up to six months.
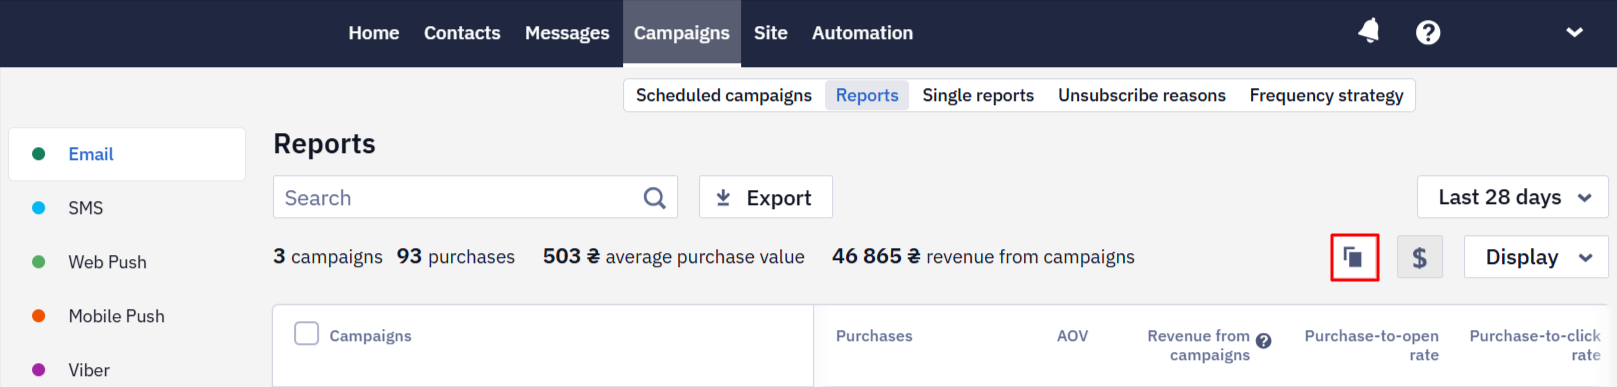
Copying Reports
To copy data to the clipboard, click the corresponding icon. Copying is carried out for the reports displayed on the page, taking into account the settings specified in the Display tab.
Viewing Revenue
The results are presented separately for each media channel and campaign type. To display revenue in the table, click the icon with the dollar symbol.
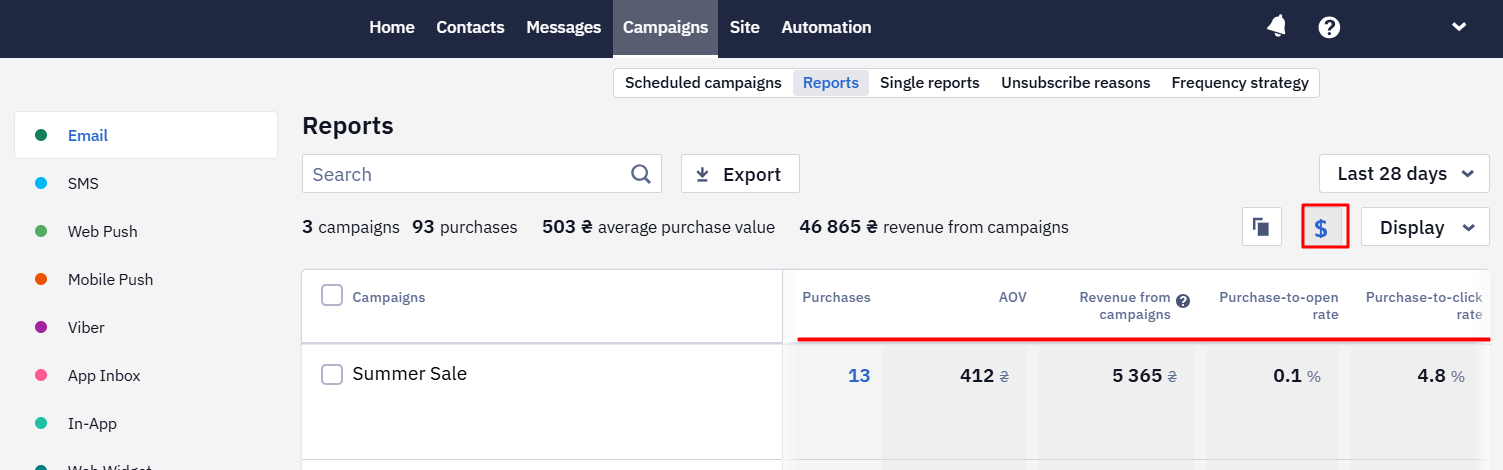
NoteTo see how much revenue a campaign has generated, enable its visualization in your Yespo account.
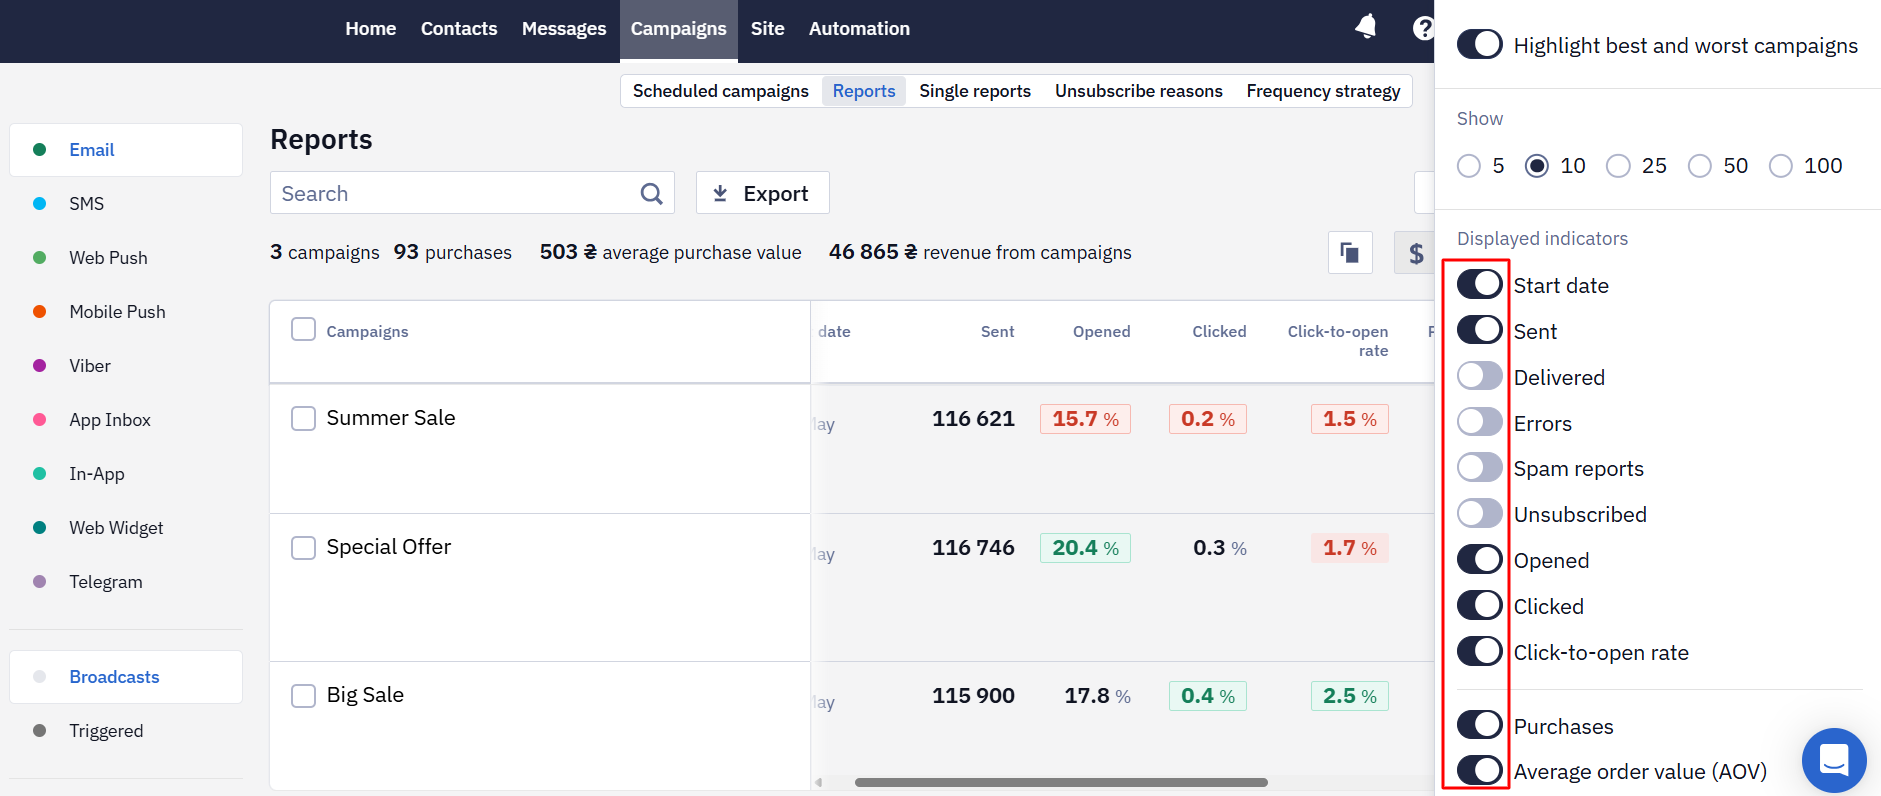
Setting Up Report Displaying
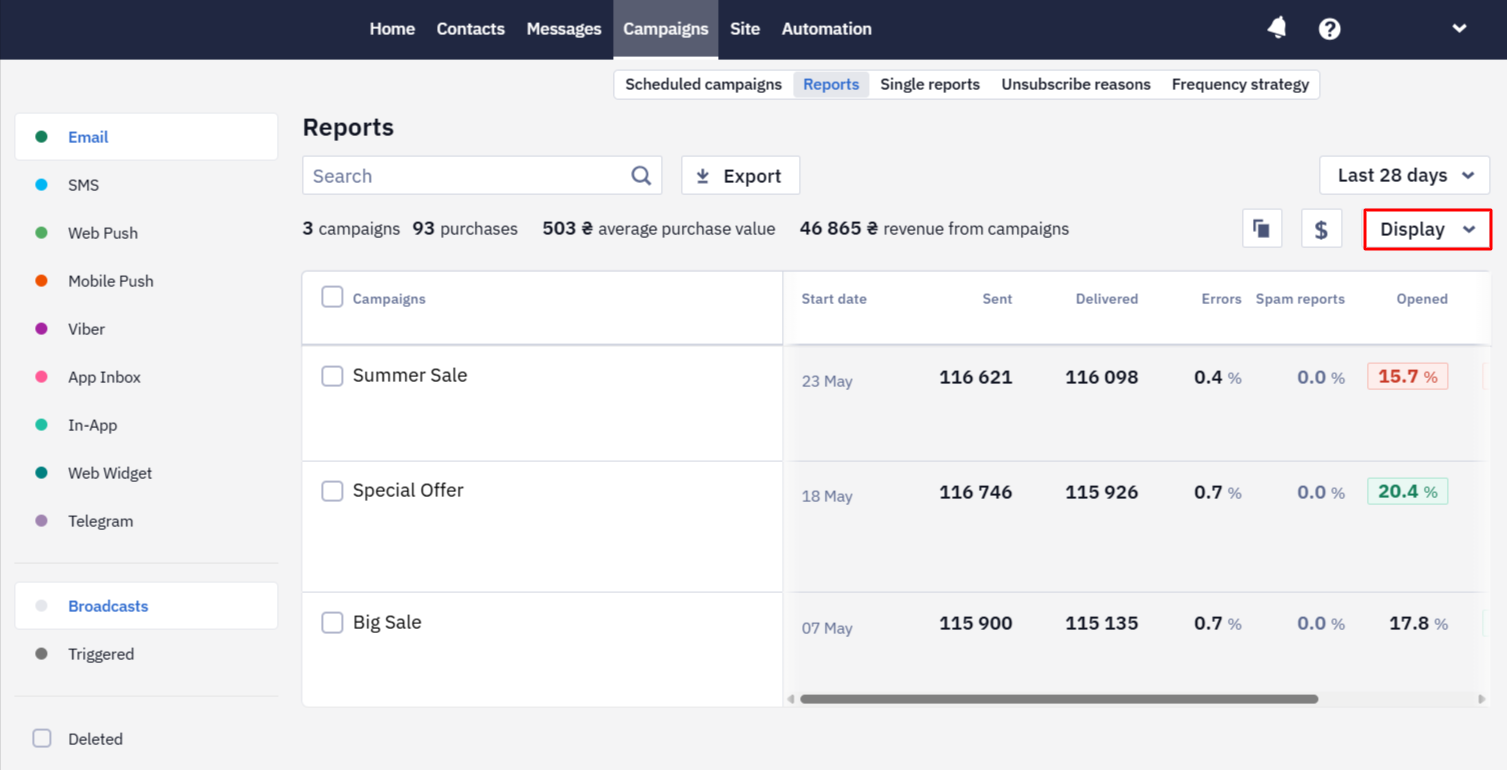
The Display tab allows you to:
- Highlight the campaigns by the best and the worst indicators.
Activate the Highlight best and worst campaigns switch. The best metrics will be highlighted in green and the worst — in red.
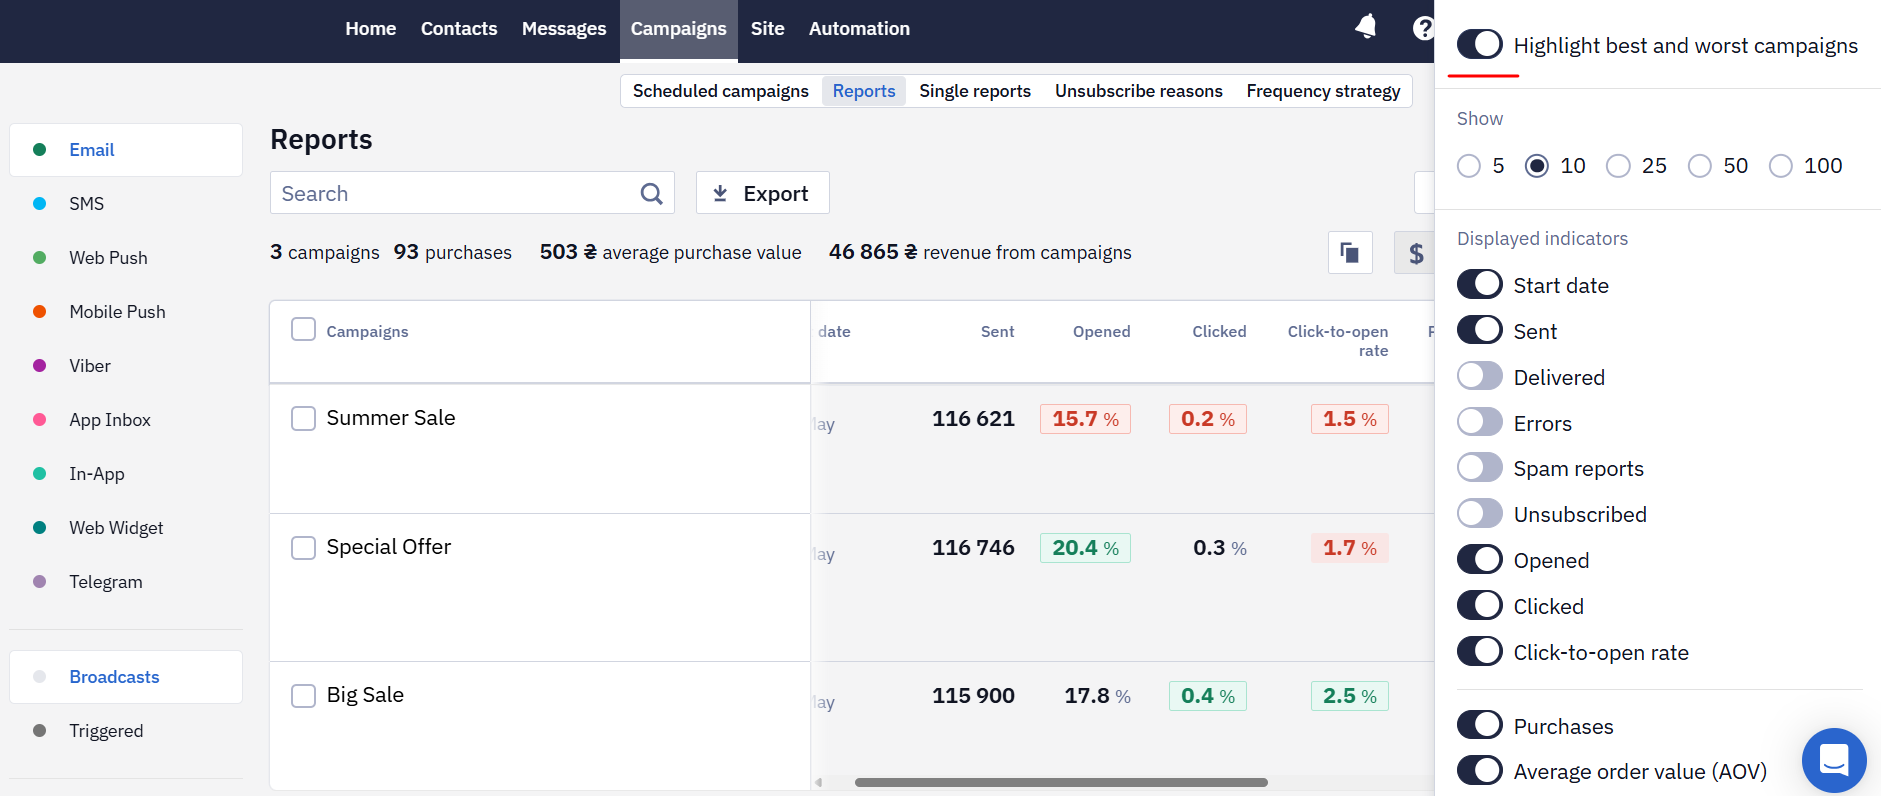
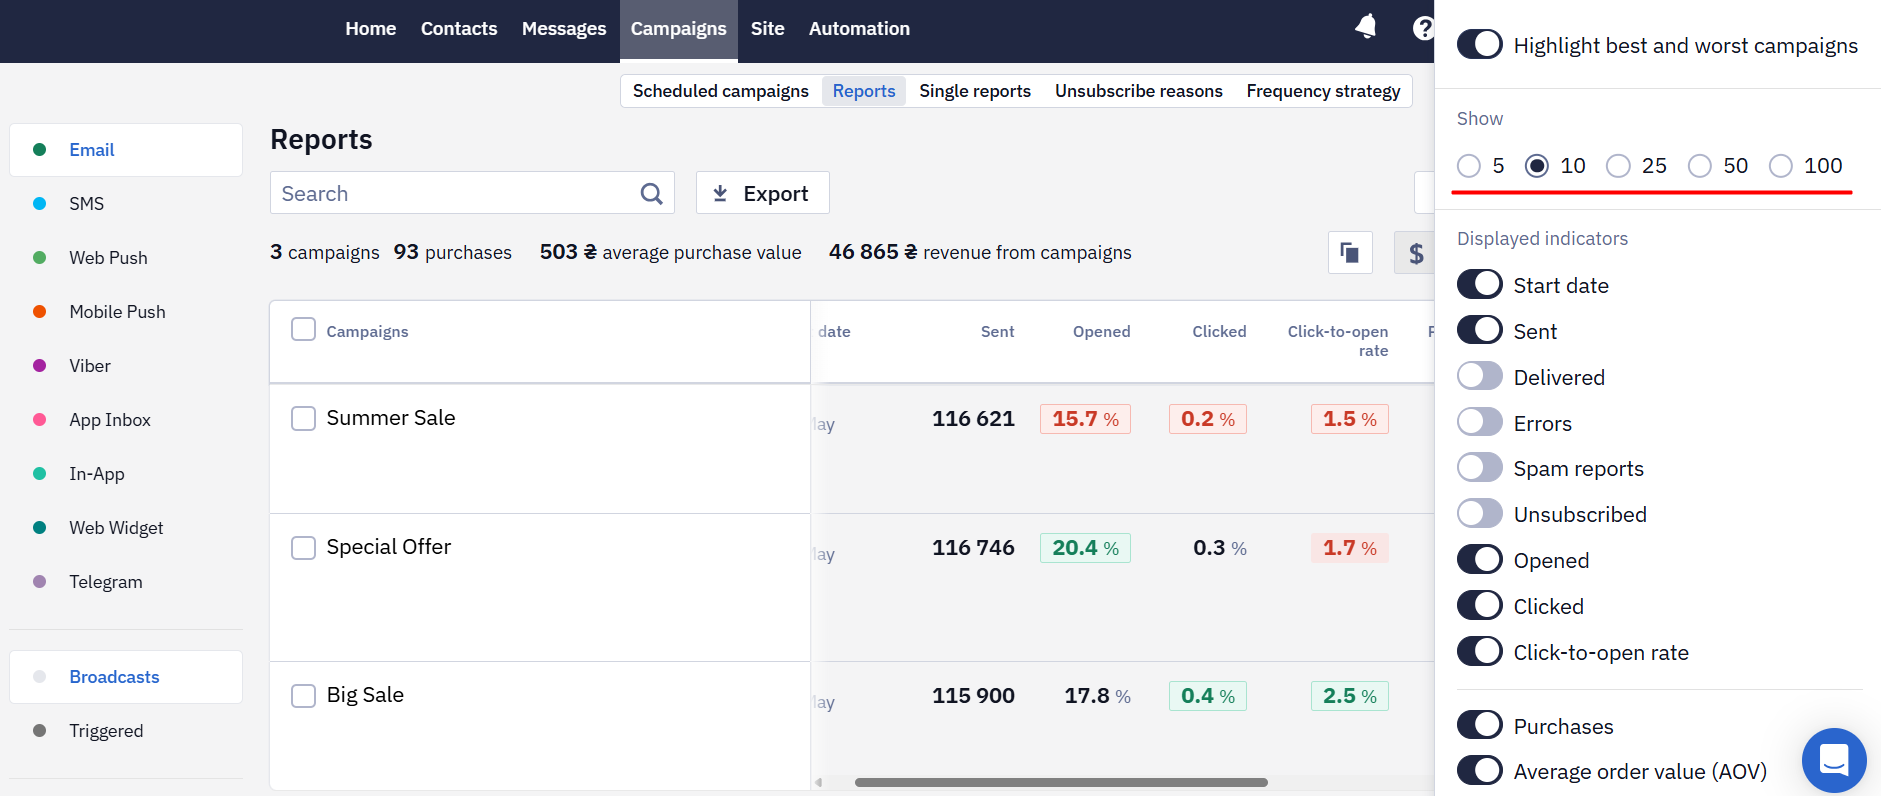
- Change the number of reports displayed on the page: 5, 10, 25, 50, or 100.
- Hide or add columns with indicators to the list of reports. For example, hide the categories of unsubscribed contacts or display the number of purchases.
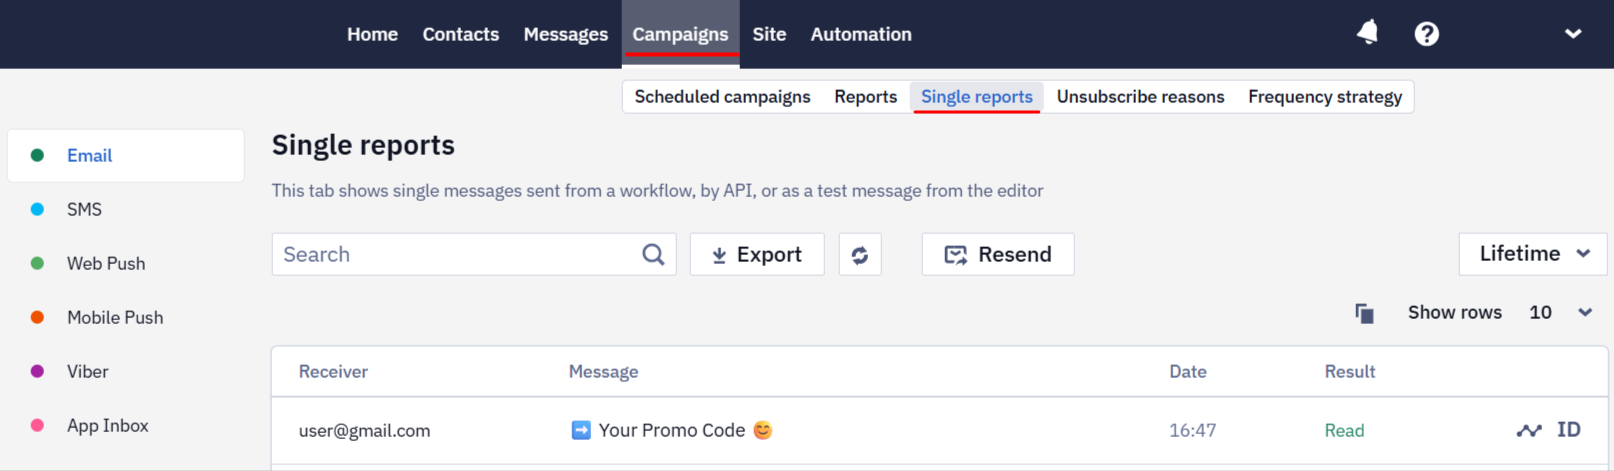
Single Reports
Single messages are sent via workflows and APIs, as well as test messages from the message editor.
See single reports in the Campaigns → Single reports section.
They are displayed as message lists and contain the following data:
- Receiver
- Message
- Date
- Result
The options for managing the Single reports section are similar to reports for broadcast and triggered campaigns.
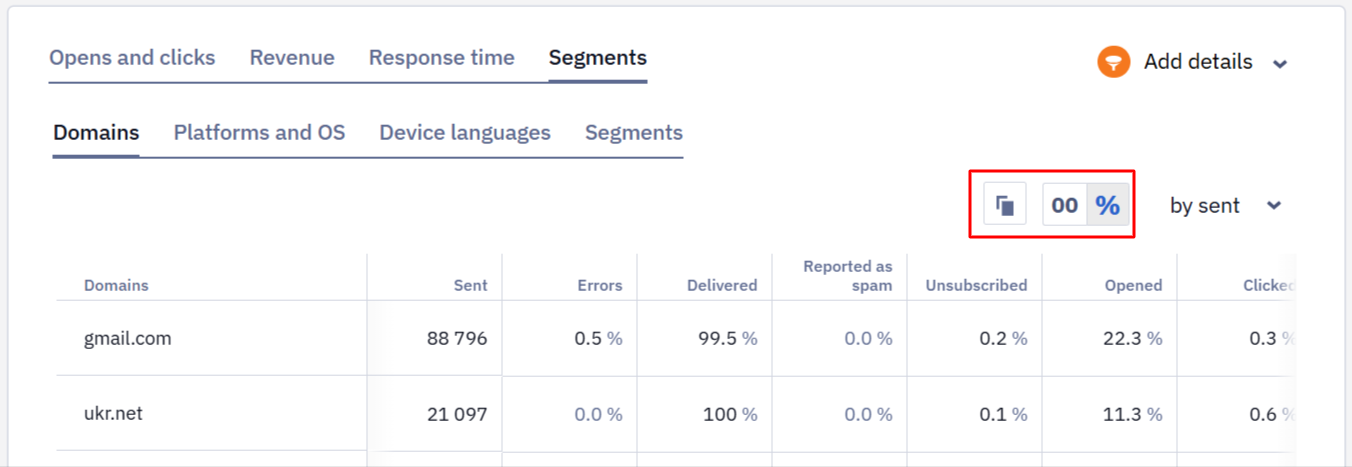
Special Icons
- The copy icon will help you quickly paste data into Excel or Google Sheets.
- The percent icon shows the data as a percentage.
- The 00 icon shows statistics in numbers.
Multilingual messages in the lists are marked with a globe icon. The number next to it indicates the number of language versions.
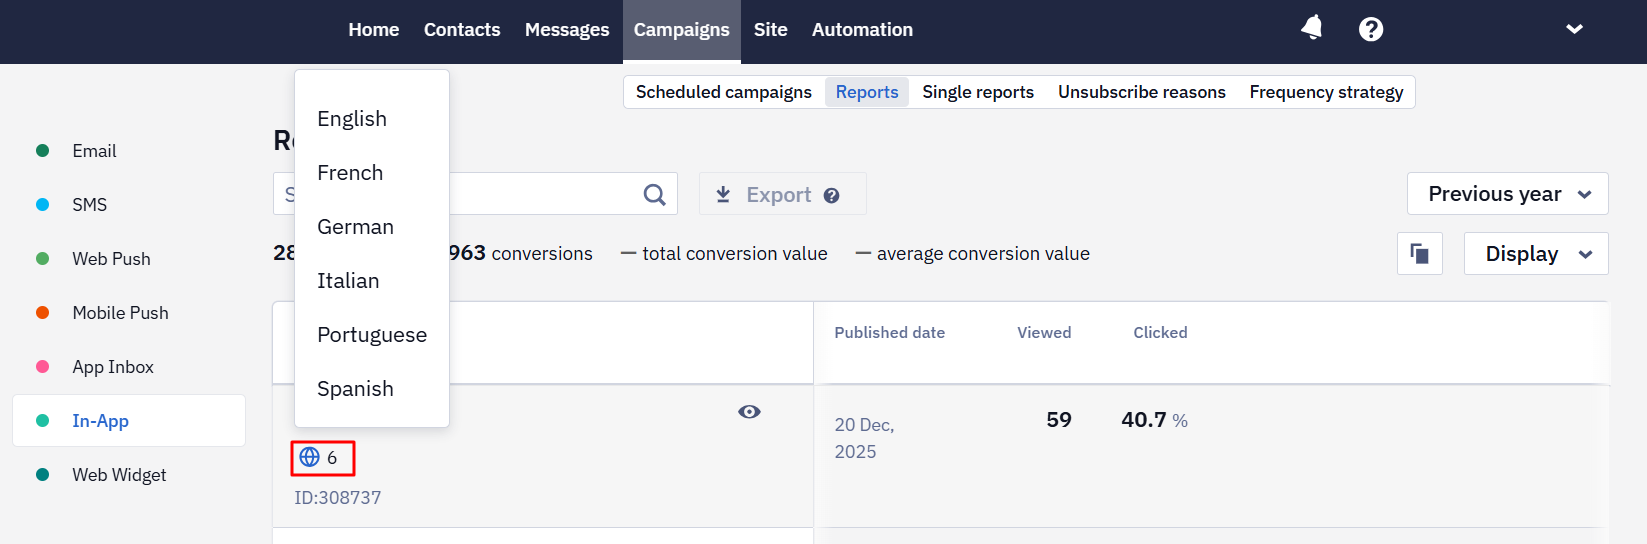
Learn more about multilingual reports >
Managing Active Campaigns
Reports on campaigns that are in the process of being sent contain Pause and Stop buttons at the top, with which you can wholly or temporarily stop the campaign. To restart it, click the Start button.

The system could also pause the campaign automatically. It happens if:
- There needs to be more funds in your account.
- The email has unique promo codes that have expired.
After you fund your account or update the list of promo codes, you can un-pause the campaign by clicking on the Start button.
Updated about 2 months ago