
A/B Testing of Recommendation Blocks
A/B testing allows you to automatically determine the best result when displaying a recommendation block based on CTR and conversions.
You can test:
- data sources — for recommendations in mobile applications and received via JavaScript API,
- names, data sources, appearance, and block placement — for Out the box recommendations.
Identify the most effective options and create new blocks based on test results.
A/B Testing Settings
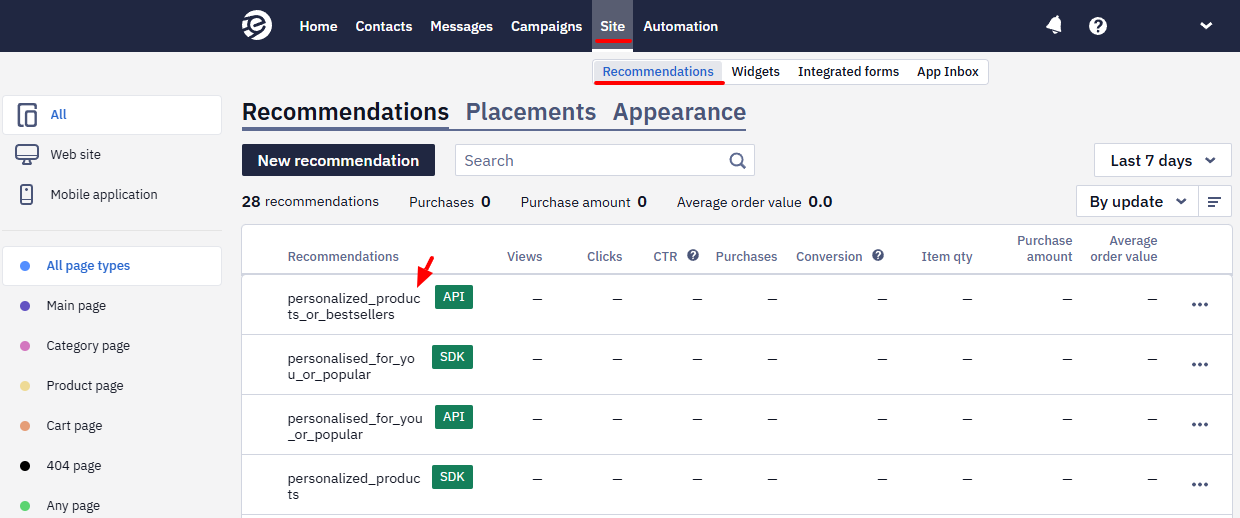
- Go to the Site → Recommendations section and click on the desired recommendation.
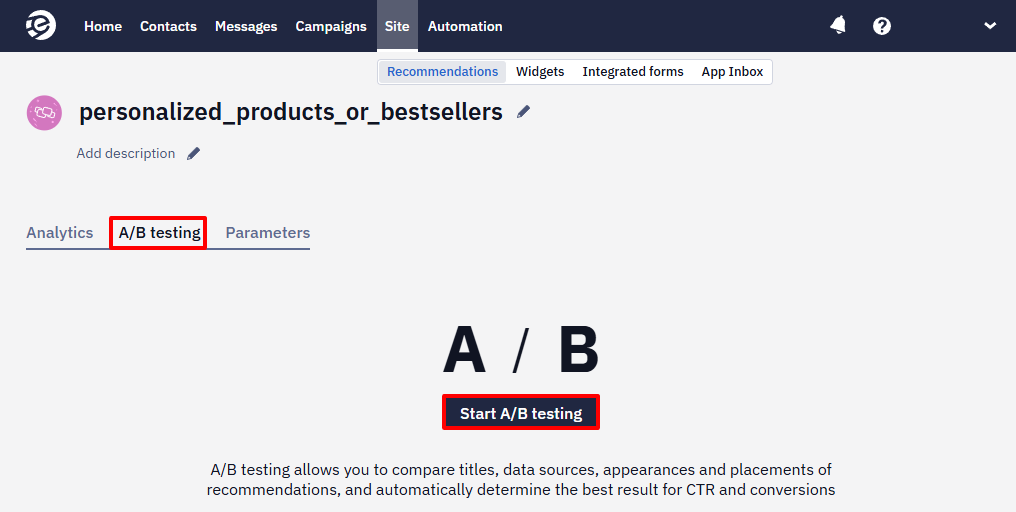
- Go to the A/B testing tab and click the Start A/B testing button.
Testing Parameters
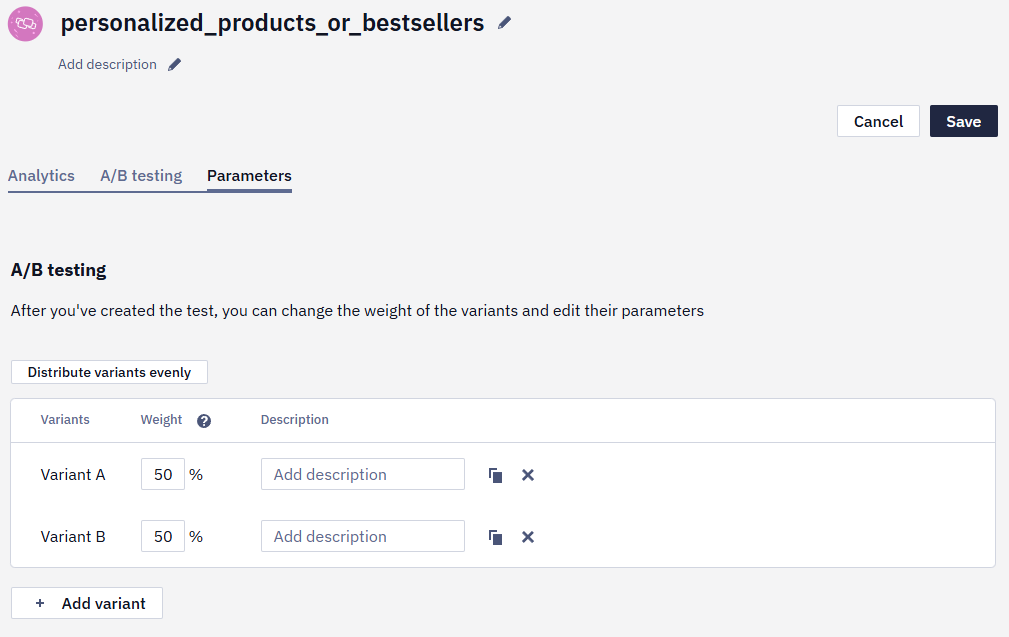
- Select the number of variants to be tested — by default, this is two; to add more, click the corresponding button (the maximum number is 8).
- Specify the percentage weight of each variant or distribute it evenly by clicking the corresponding button.
- Add a description of the variants so that in the future, you can easily recognize the key differences between the variants being tested (optional).
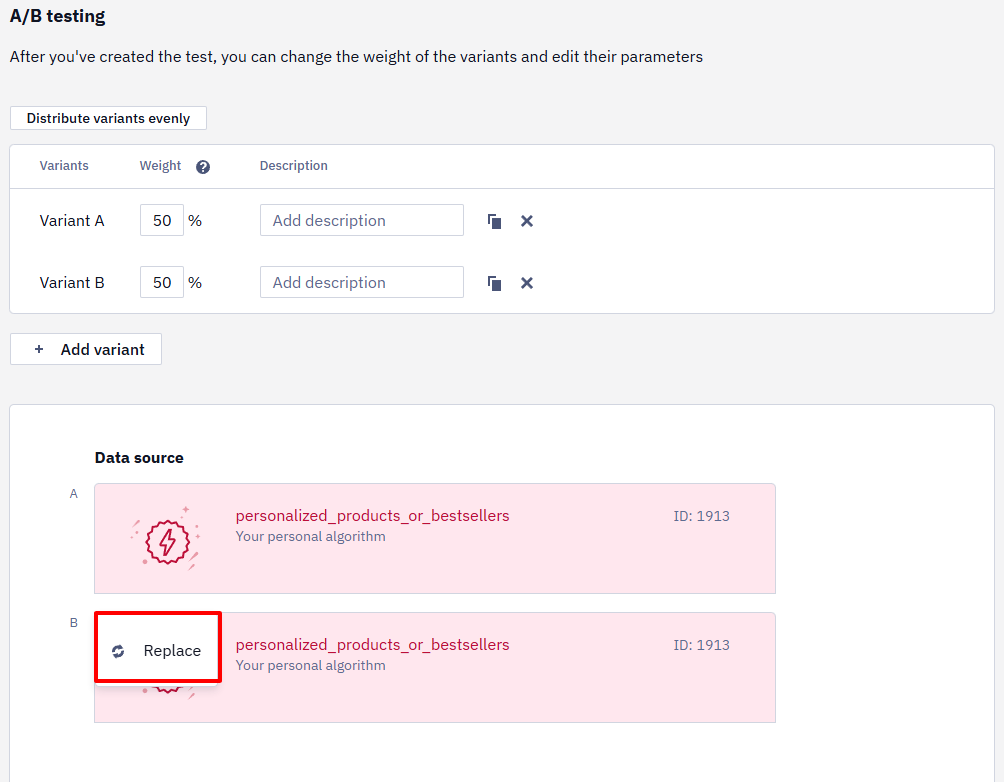
Below, select the parameters you will test. Testing one parameter at a time is better to understand which factors influence the results.
Data source. Specify which algorithm will generate recommendations. To change it, click the option and select the desired one from the list.
Placement: Specify where you want to place the recommendations on the page.
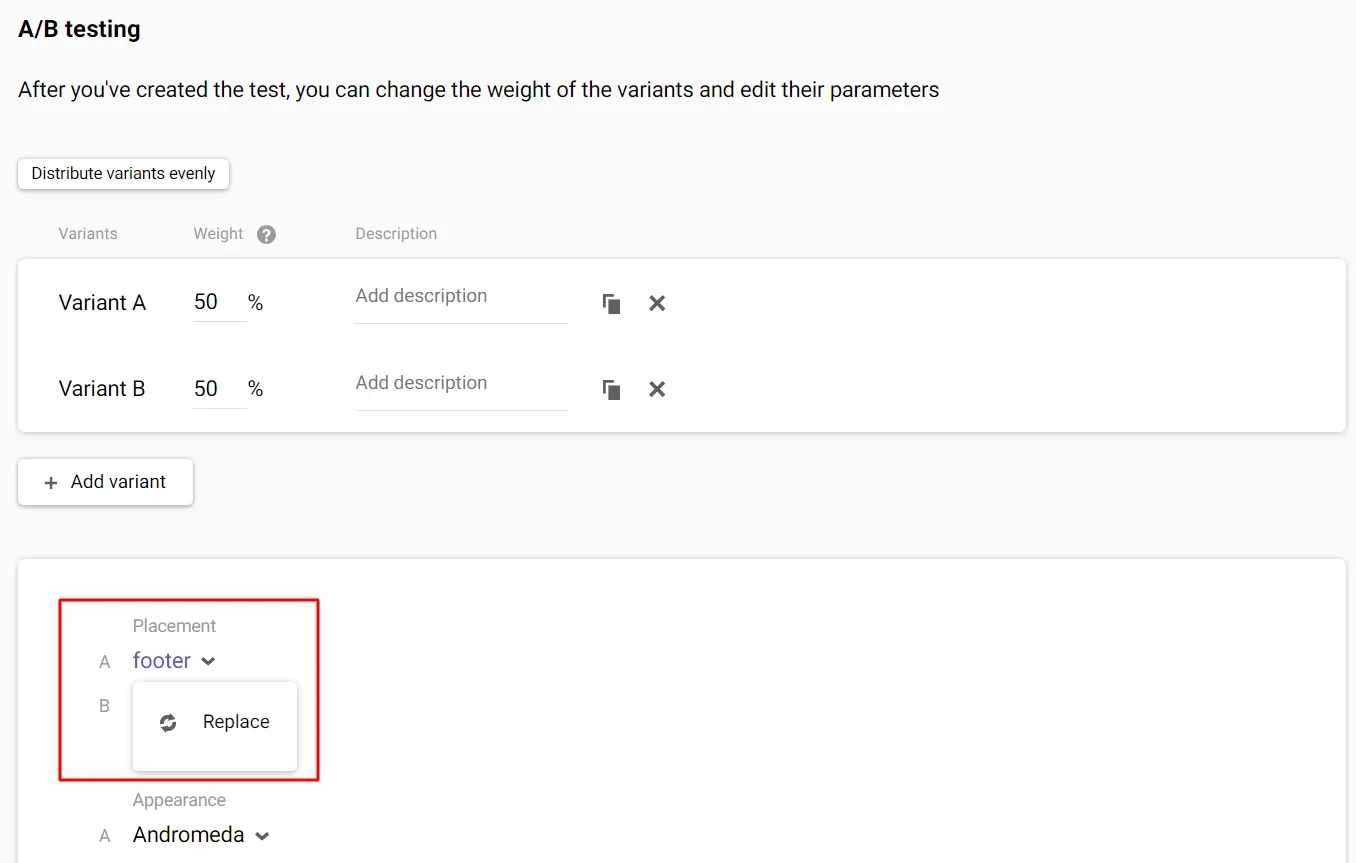
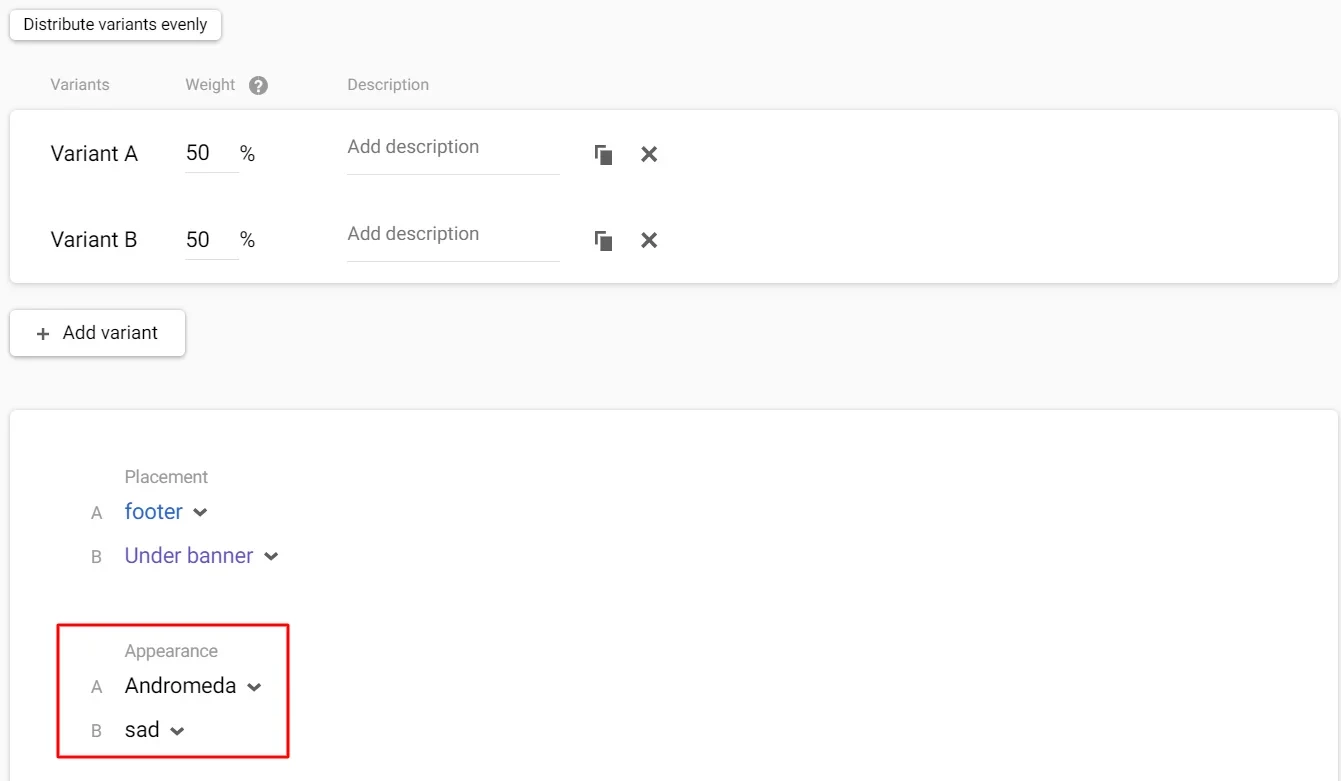
Appearance: Specify the variants that will be included in the test.
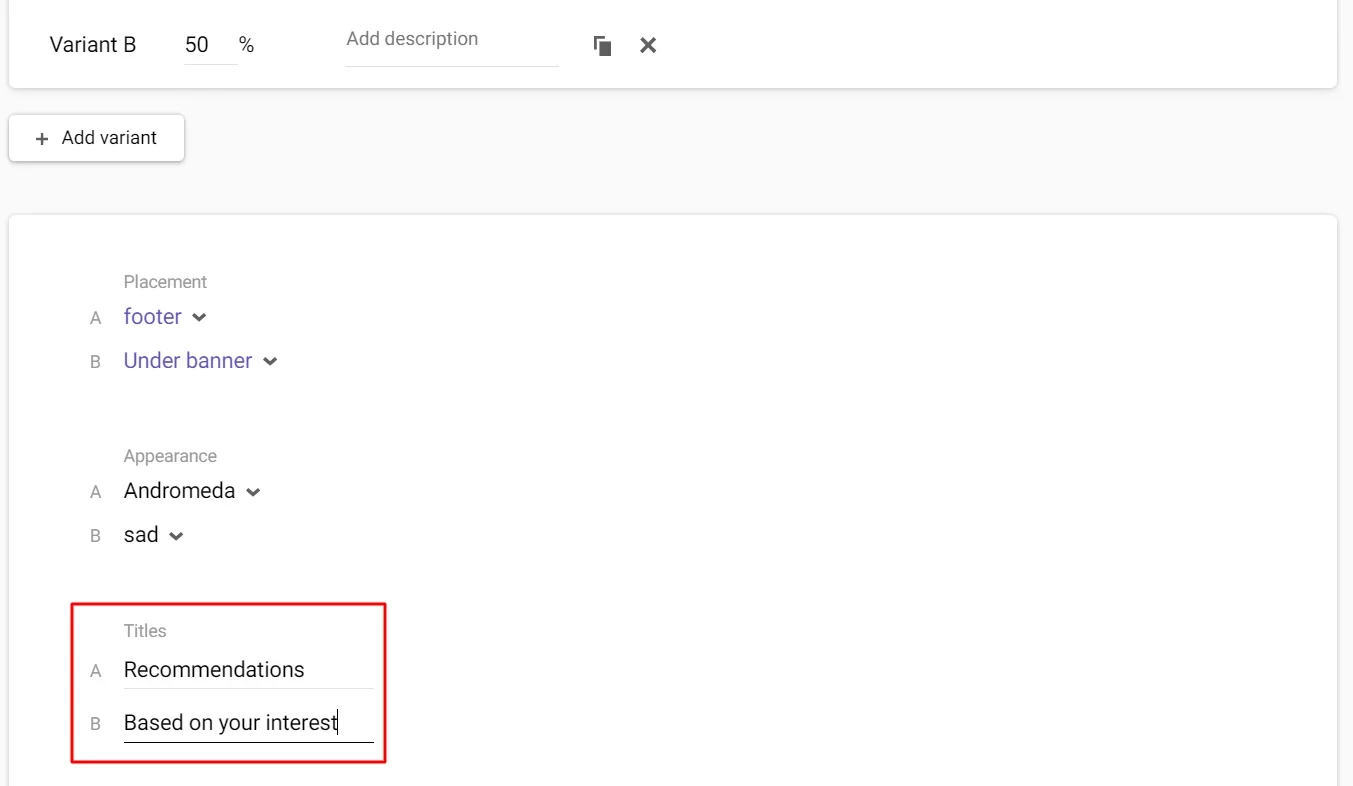
Titles. Write down different options to see which one is more attractive.
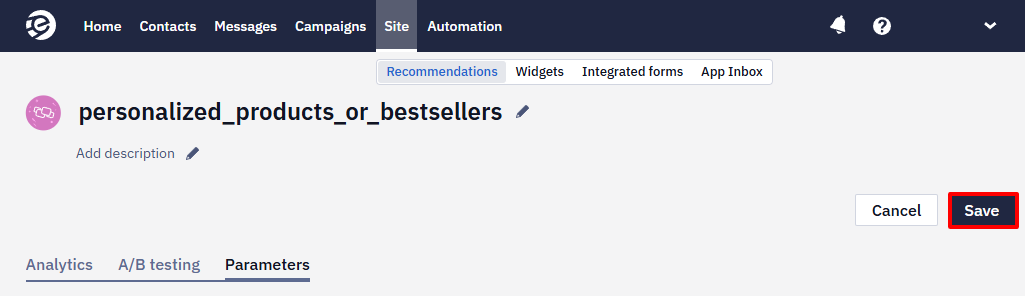
After making your settings, click the Save button at the top of the page.
Testing Status and Its Assessment
In the general list of created recommendations, each recommendation that has been A/B tested has a corresponding mark in the form of a button.
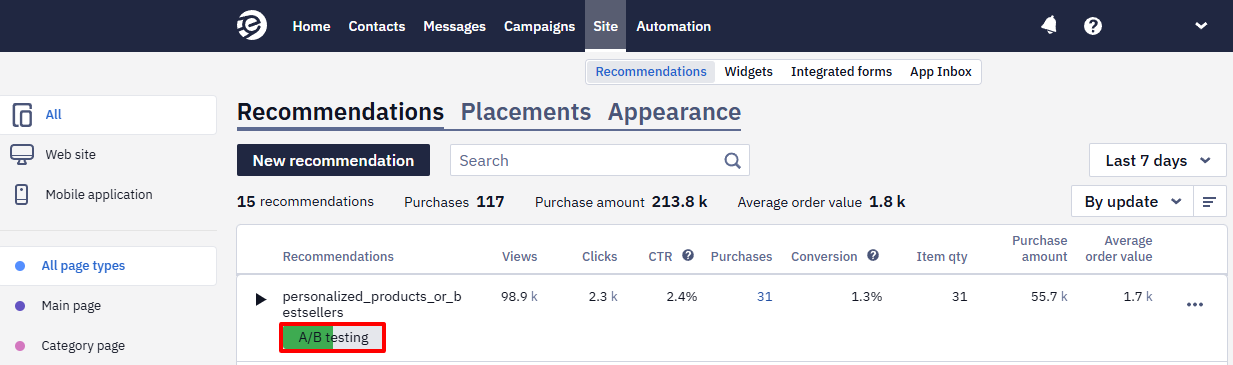
The button is colored differently depending on the current status (completed/not completed) and key results (by CTR and achieved conversions). When you hover over it, a short report opens. Click the View test button to view the results in detail.
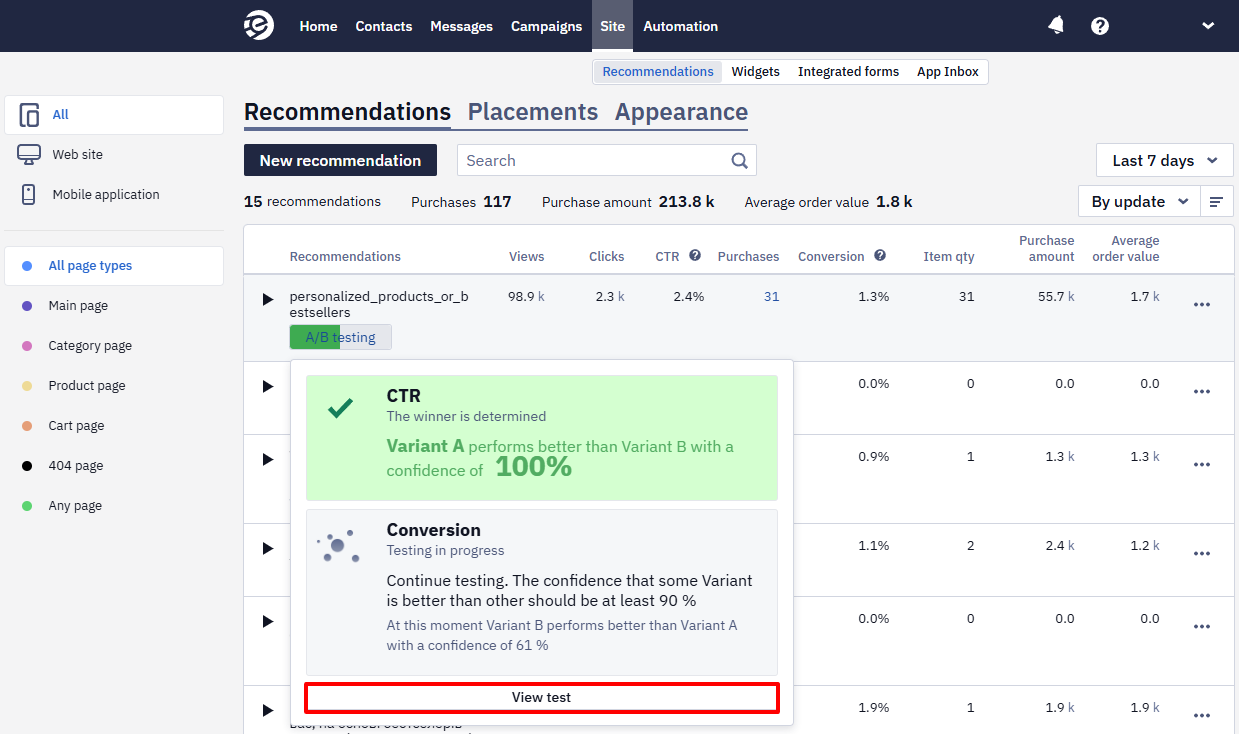
Color coding:
- The green button – testing is complete; there is a winner by CTR and conversion.
- The gray-yellow button indicates insufficient data to determine the winner by CTR; the conversion is the same.
- The yellow button – CTR and conversion statistics are the same, and testing continues.
- The green-yellow button indicates a winner by CTR, and conversion statistics are the same. Testing continues.
- The yellow-green button – there is a winner by conversion, and CTR results are the same.
- The grey button – there is insufficient data to determine the winner by any indicator.
Test Results Report
The winner is displayed with the results obtained on the first screen of the test viewing.
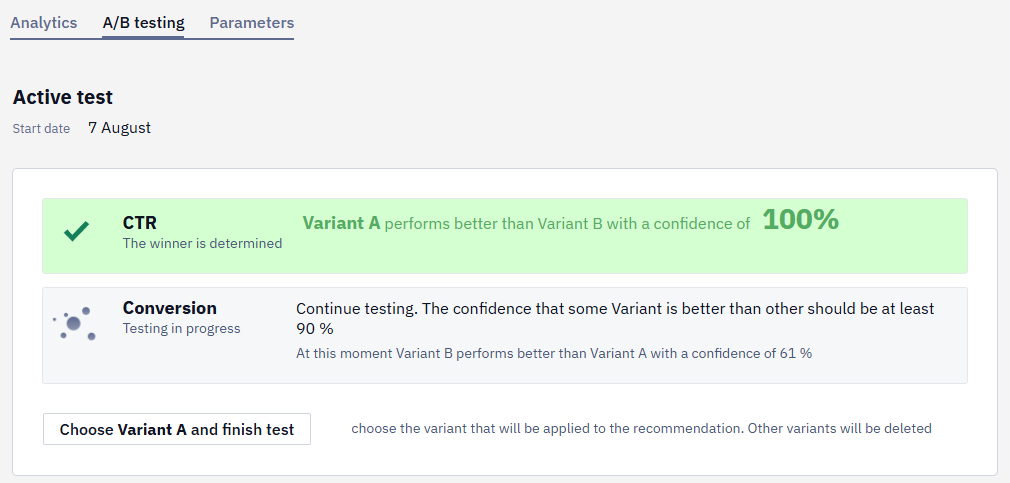
To determine a winner, one of the variants must be in the lead with a probability of at least 90%, and the difference in probability between the variants must be more than 5%. Testing will continue until this minimum threshold is reached.
If there is enough data, you can stop the test by clicking the Choose Variant and finish test button (the variant that performed better will be written in bold text).
If the winners by CTR and conversion are different variants, then only the winner by conversion can be the best since sales are more important than the click-through rate. When you finish the test, however, the interface applies the winner by CTR. To keep the variant that won by conversion, finish the test and then set that variant's algorithm in the block settings yourself.
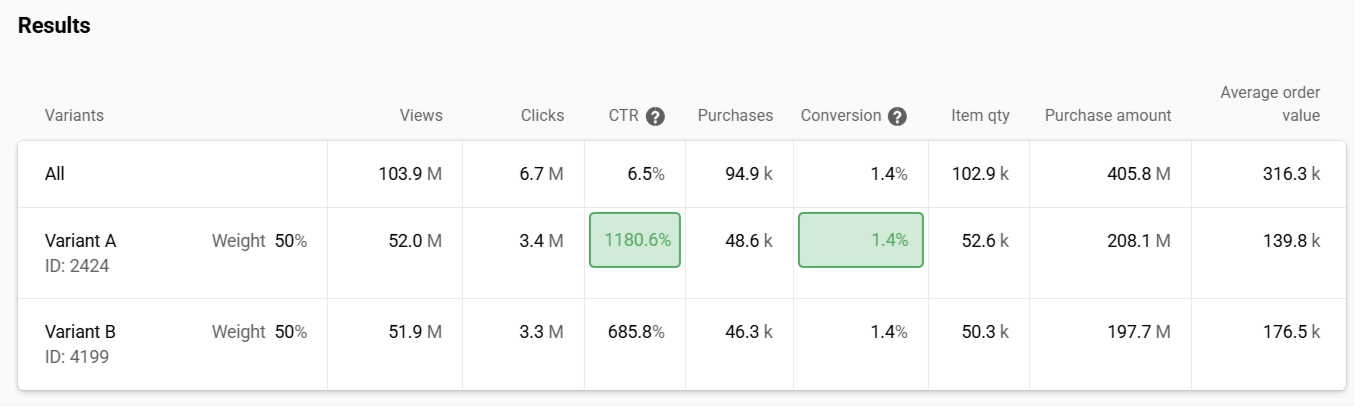
After describing the preferred option, a report with the testing results for each option is presented.
The green frame shows the winning variant's CTR and conversion rates. Below the variant is the ID of the data source being tested.
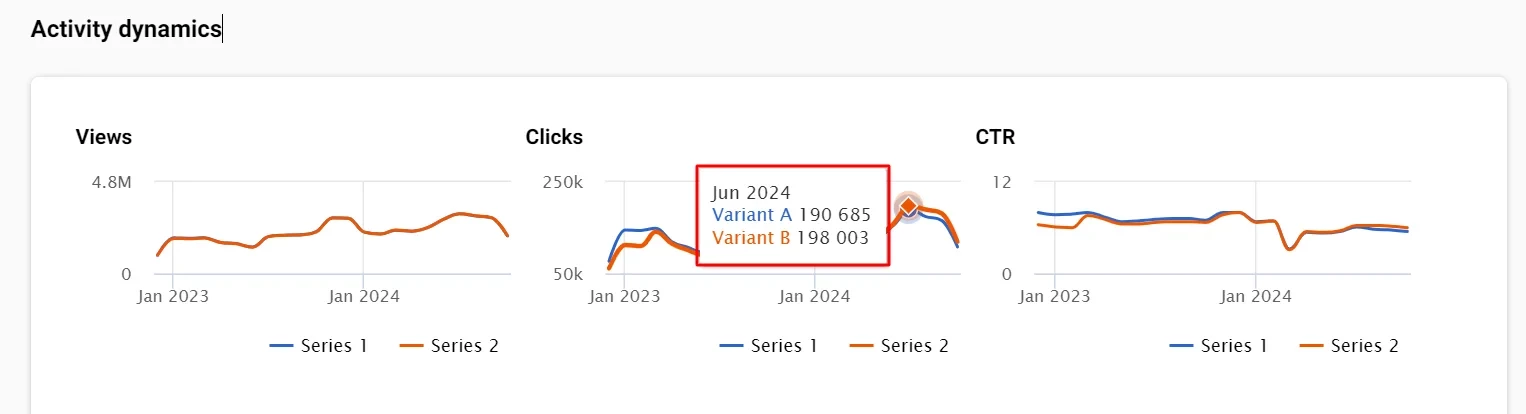
In the last block of the report (Activity dynamics), graphs visualize the results obtained compared to other test variants.
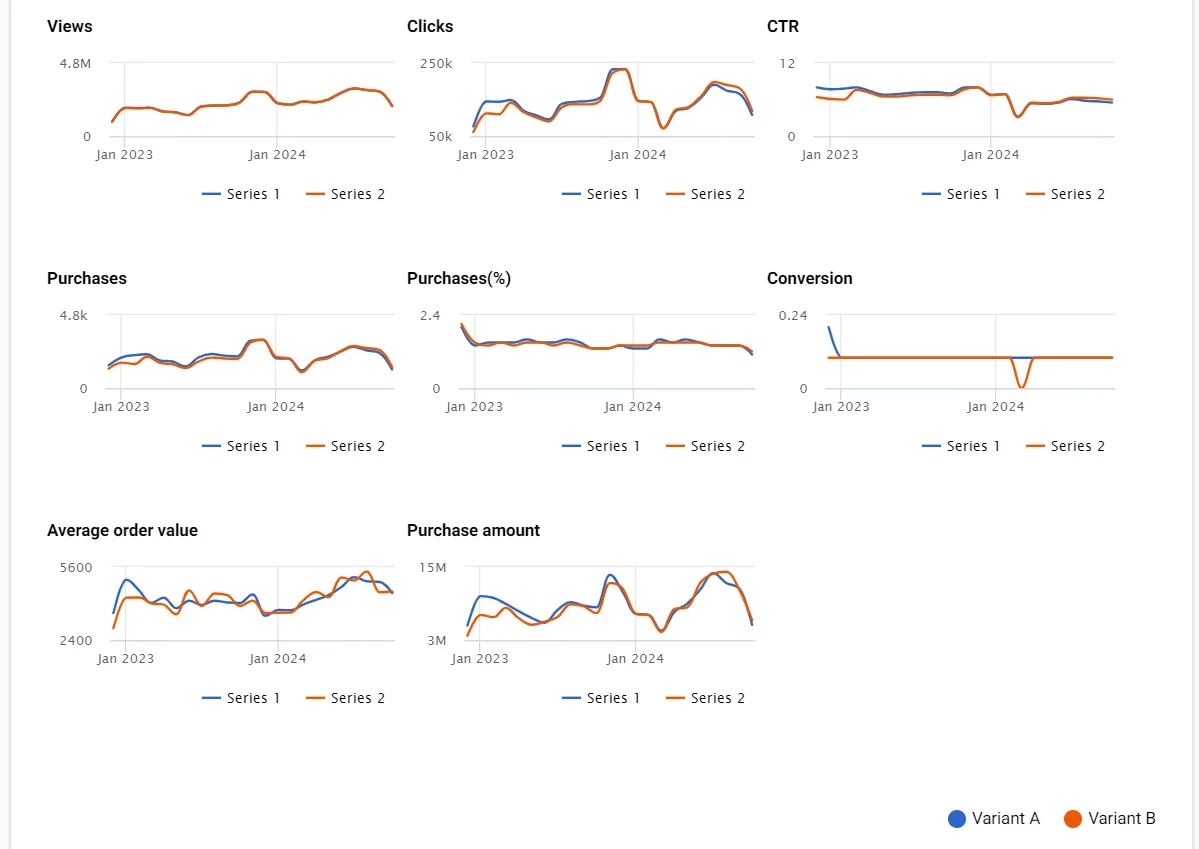
To see the number of indicators for a certain period, hover over the graph:
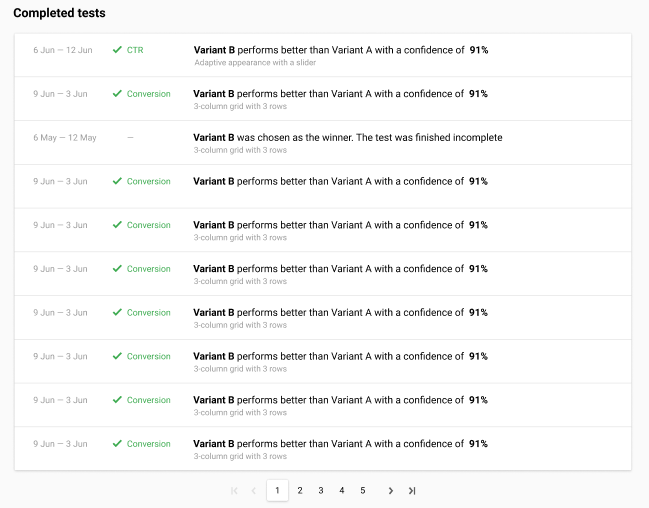
The history of completed tests is displayed at the bottom of the page:
Updated 18 days ago