
Bulk Email Reports
The report consists of 4 parts.
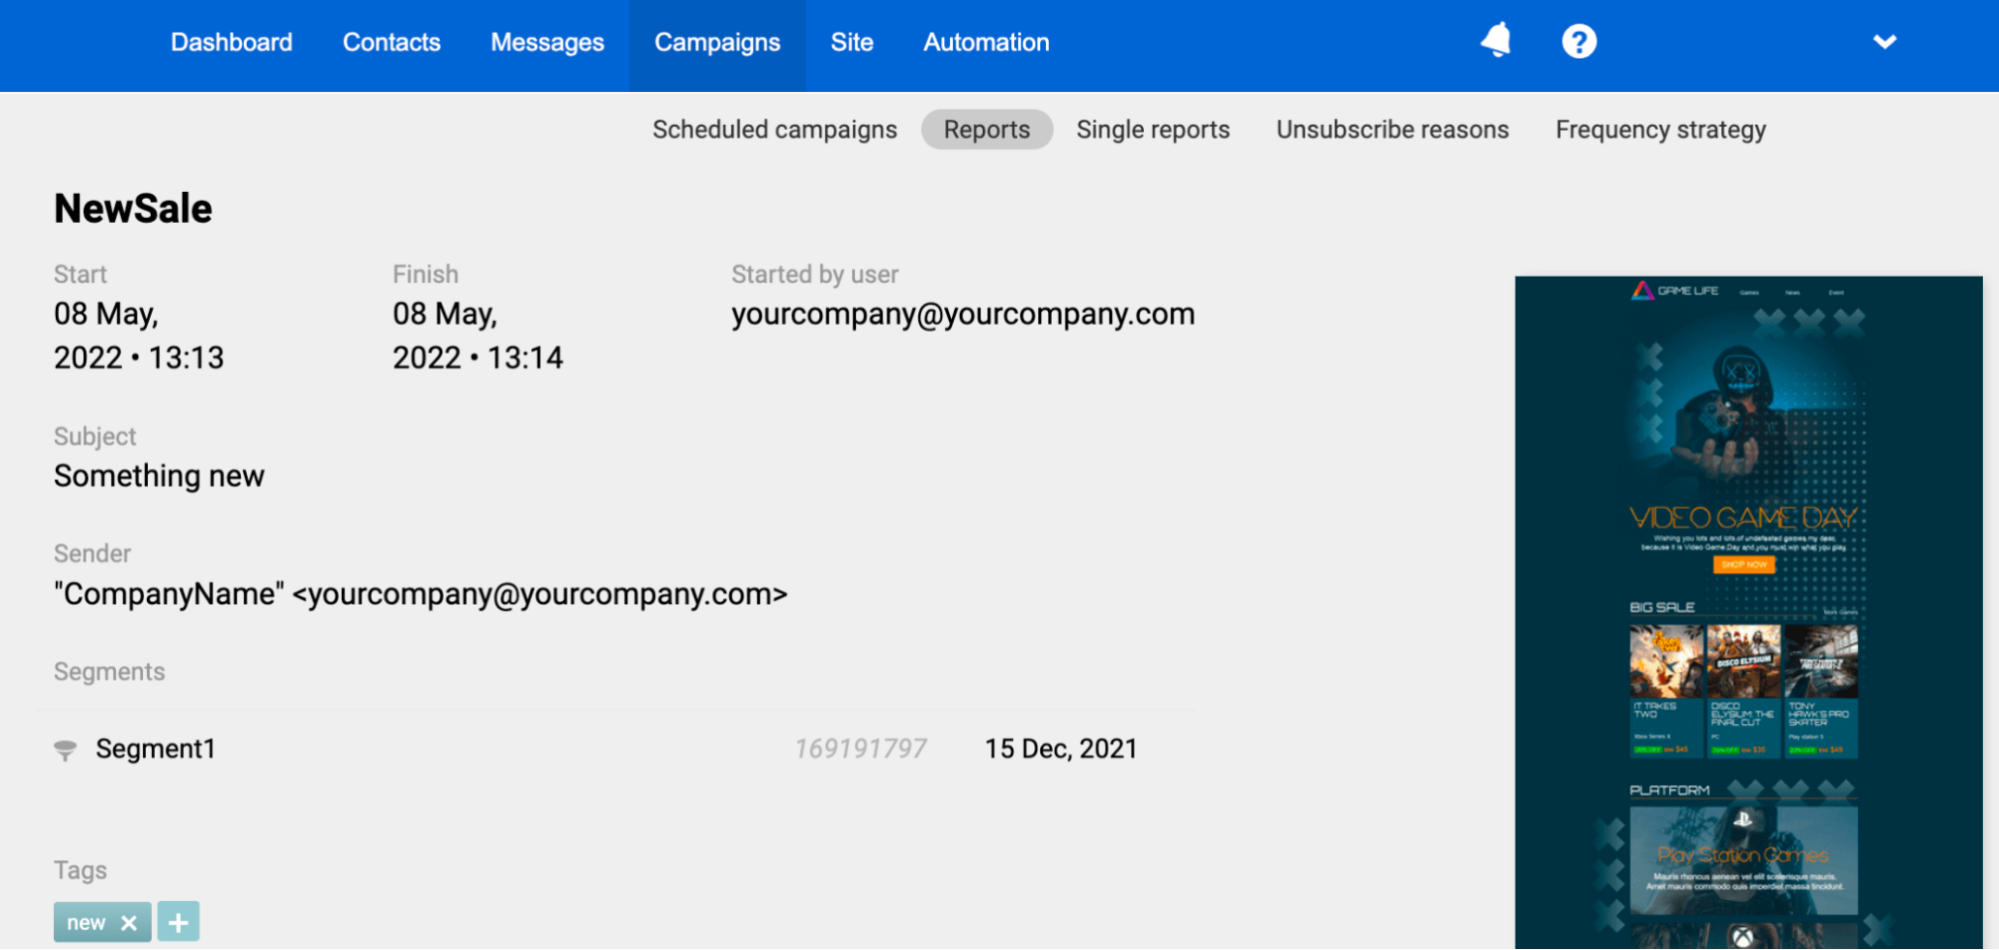
1. General Information
The first part of the report provides the following information:
- Name of the email.
- Start and Finish: when the campaign was launched and when the email was sent to all the contacts.
- Sender name.
- Started by user: displays the email of the user who has started the campaign.
- Segments of contacts to whom the email was sent.
- Subject line. If you test several subjects, they will be displayed as a list.
- Tags for quick search and filtering of messages.
- Annoyance level (optional).
- Email preview.
If you send a campaign to a large list or with a limited speed, the Start/Pause and Stop buttons will be available, so you can temporarily suspend, completely stop or restart the campaign.
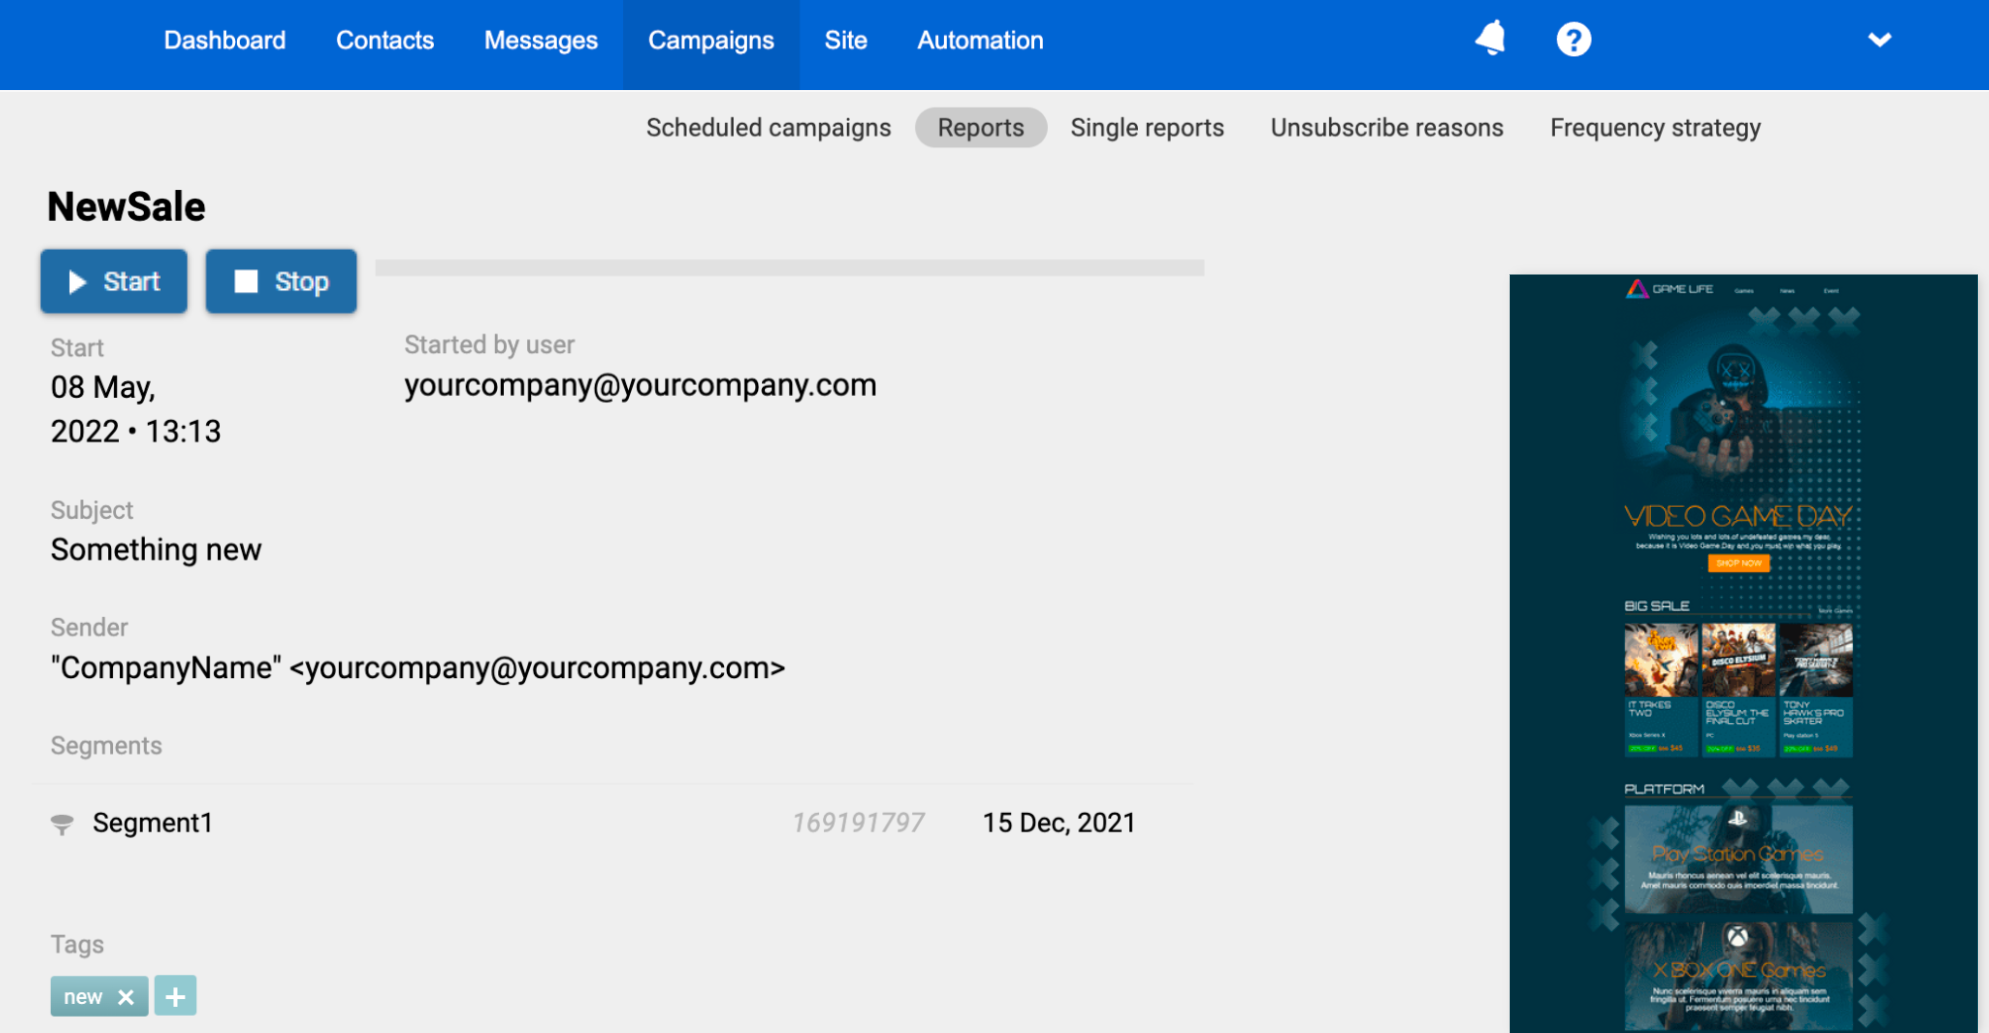
The campaign is automatically paused if:
- Not sufficient funds.
- The email uses unique promo codes, and they are out of stock.
After adding funds or renewing the list of promotional codes, you can unpause the campaign here.
2. Email Statistics
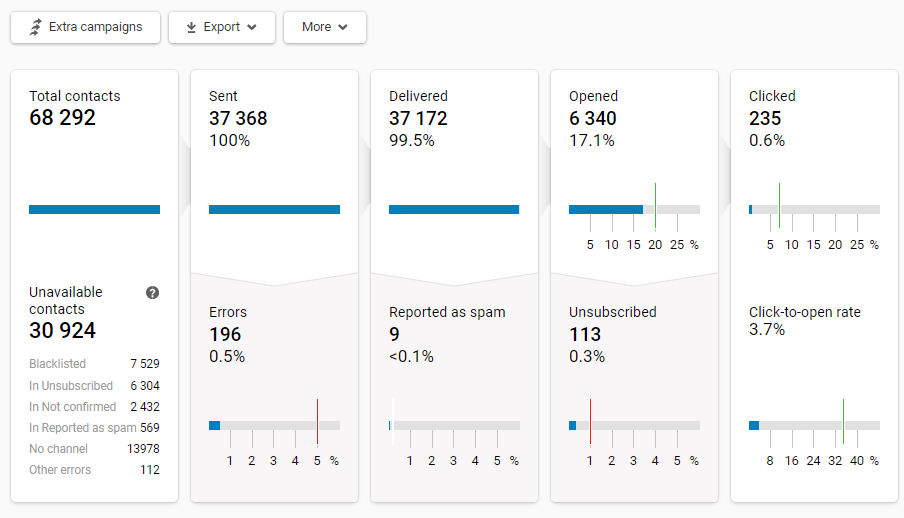
In this part of the report, you can see detailed statistics on the campaign.
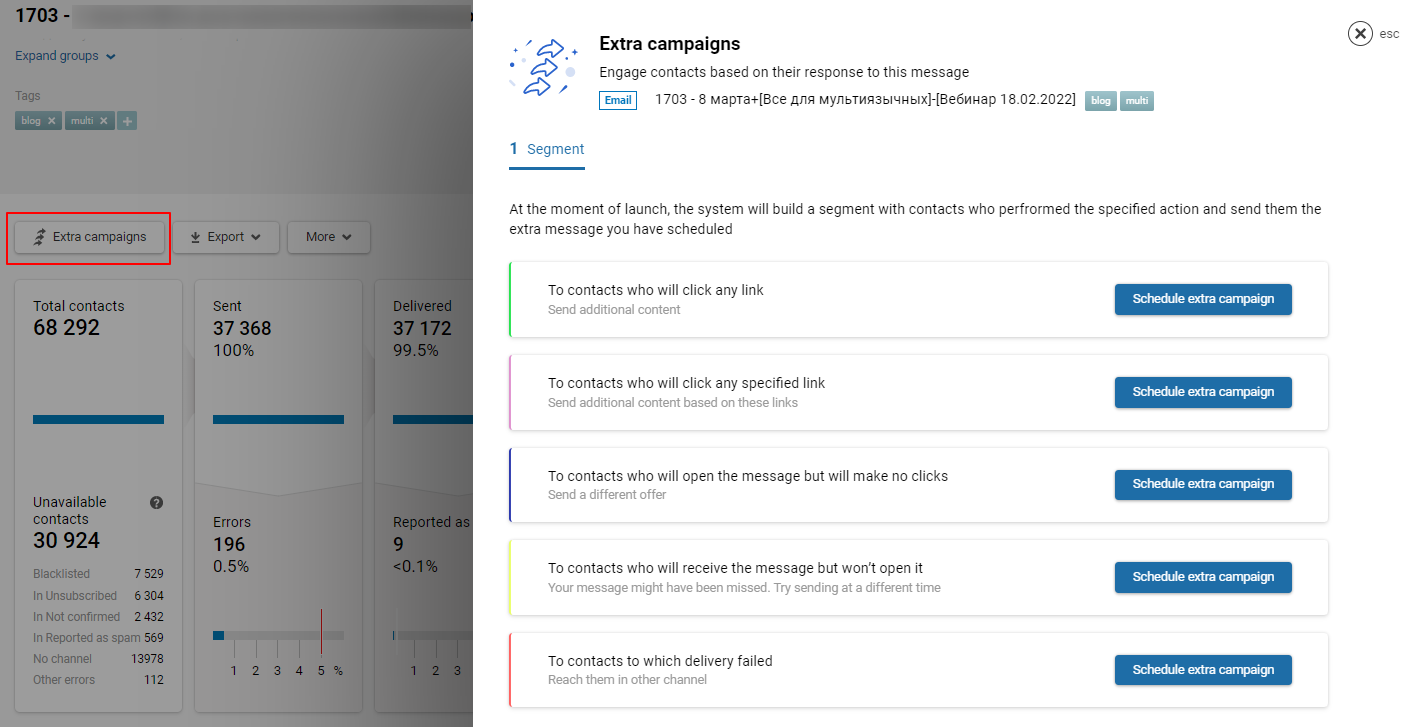
Extra campaigns function allows you to engage users based on their response to this message. At the moment of launch, the system will build a segment with contacts who performed the specified action and send them the extra message you have scheduled.
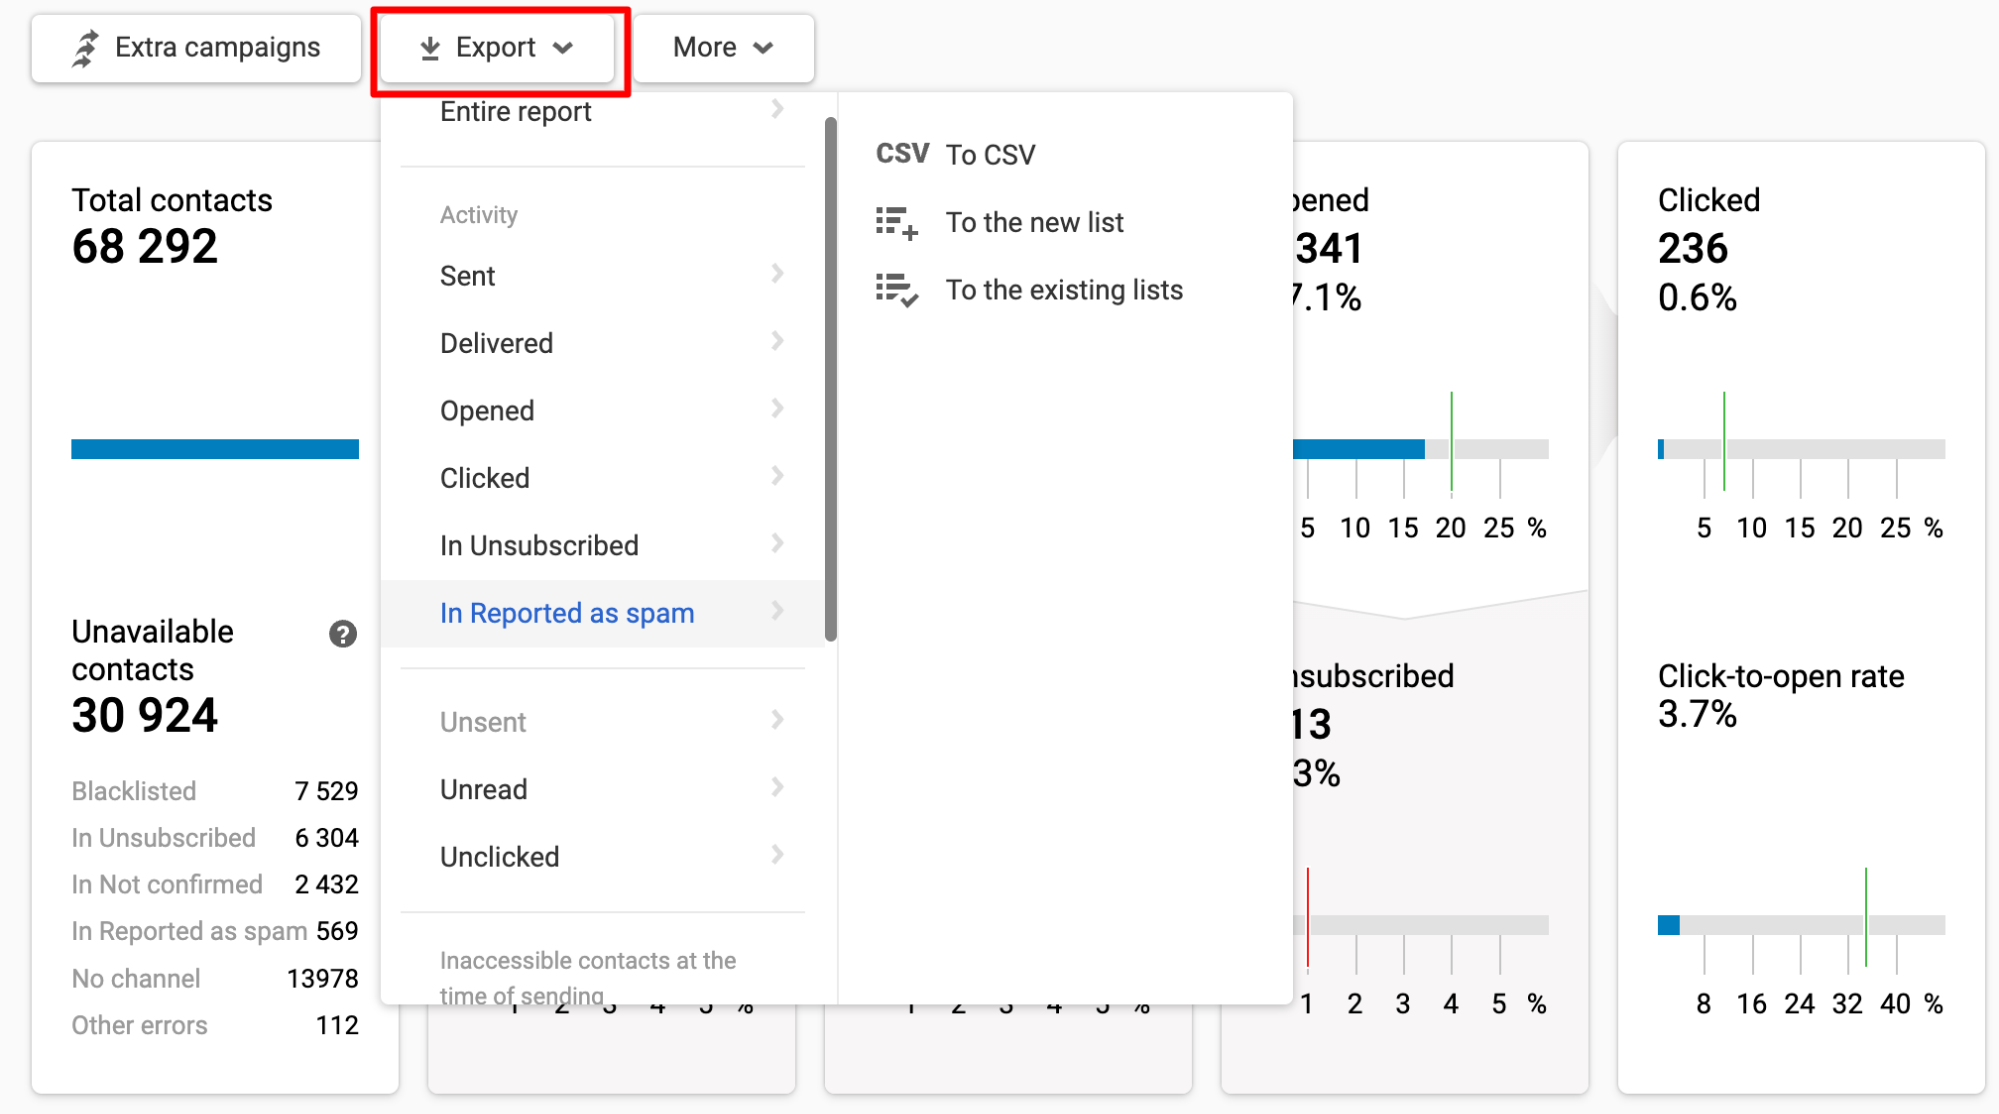
By clicking on the Export button, you can export the segments by:
- Activity: Sent, Delivered, Opened etc.
- Inaccessible contacts at the time of sending: Blacklisted, Is Not confirmed, In Unsubscribed etc.
NoteContacts to whom a message was not sent when checking for a subscription category, fall into the In Unsubscribed category
- Errors, where you can export contacts:
- To the new list;
- To the existing list;
- Send as a CSV file to the email address used to log in to Yespo.
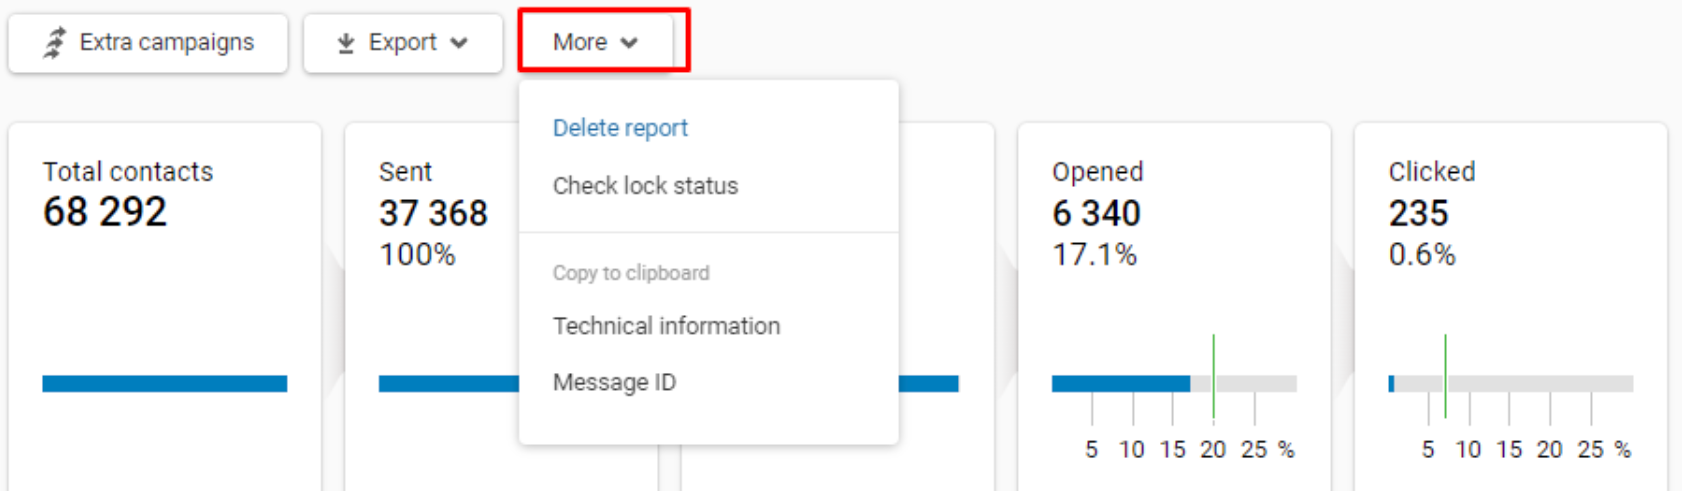
By clicking the More button, you can delete the report, check lock status, and copy technical campaign information and message ID to the clipboard.
3. Revenue
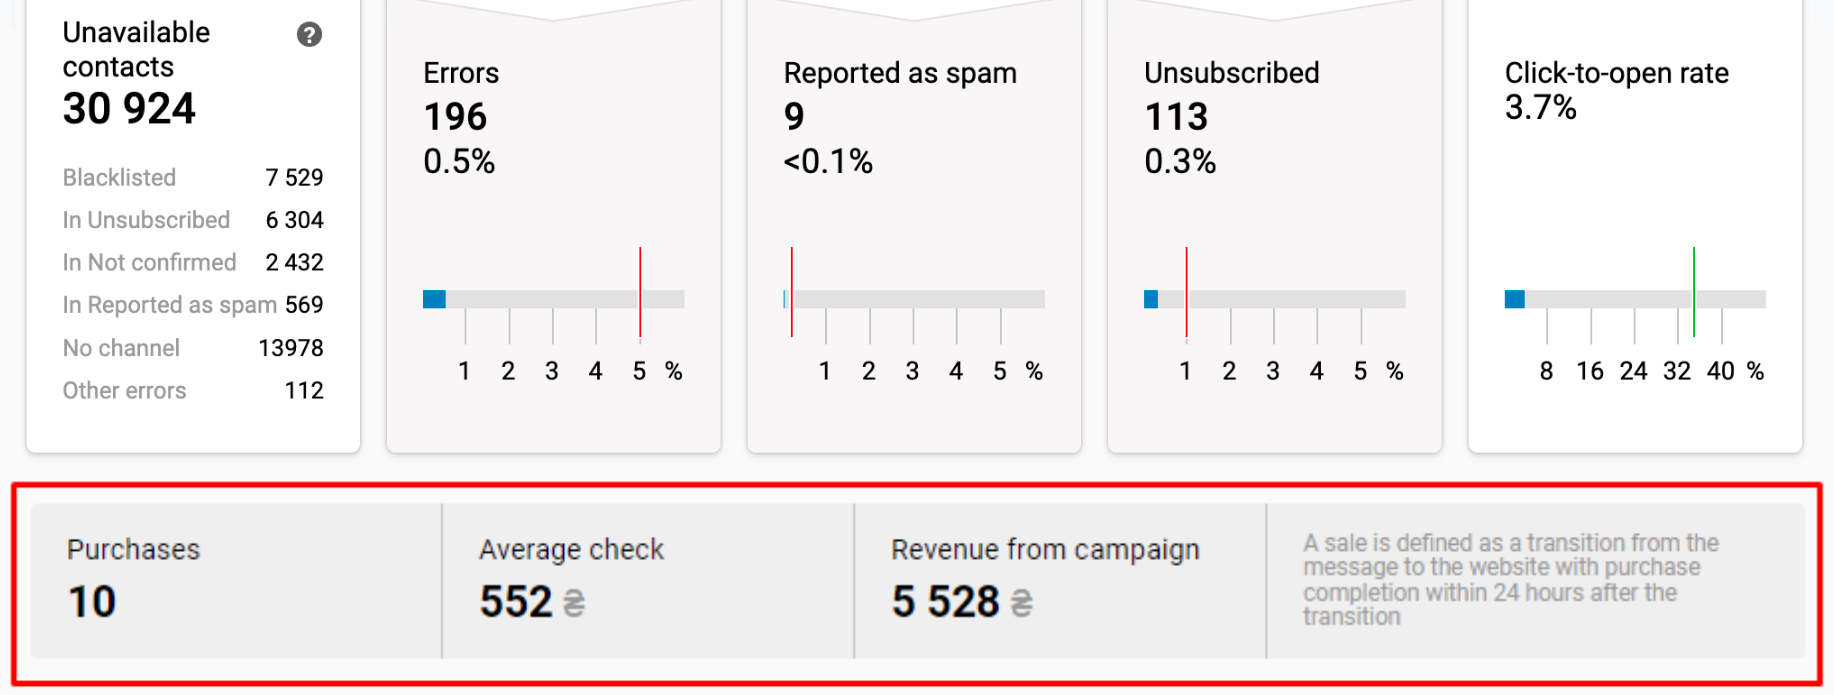
If you set up integration with a CRM system that records order data, you can evaluate the financial results of the campaign.
4. Campaign Performance
4.1. Opens and clicks
In the section Opens and clicks you can see:
- Click map — displays the percentage of clicks on the links in the email.
- Table of clicks — shows the number of clicks on each link in the email.
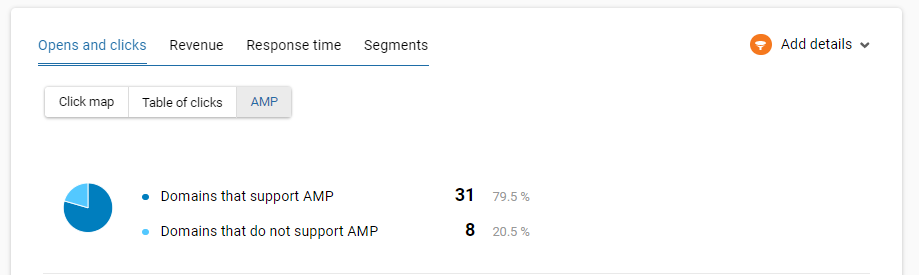
- AMP — shows the percentage of domains that support AMP. First of all, in order to send AMP emails, you need to become a trusted sender.
4.1.1. Click map
Click map displays the percentage of clicks on the links in the email.

Click map reports can show the statistics sorted out by contacts or by click rate:
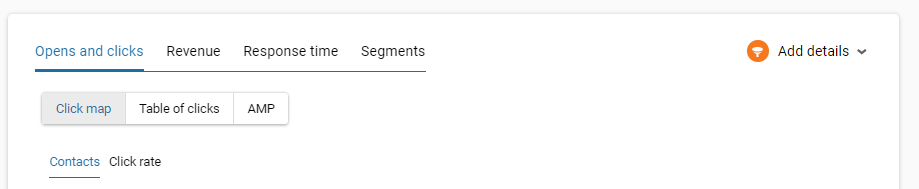
- Statistics by contact show the percentage of users who clicked on any of the active links in the email. If one user clicks on one link several times, you would see this in the report. The total percentage of clicks can exceed 100%.
- Statistics by clicks show the percentage of clicks on each link. The total number of clicks is set to 100%, and the report shows the rate of clicks each link receives.
4.1.2 Table of clicks
This tab shows the number of clicks on each link in the email.
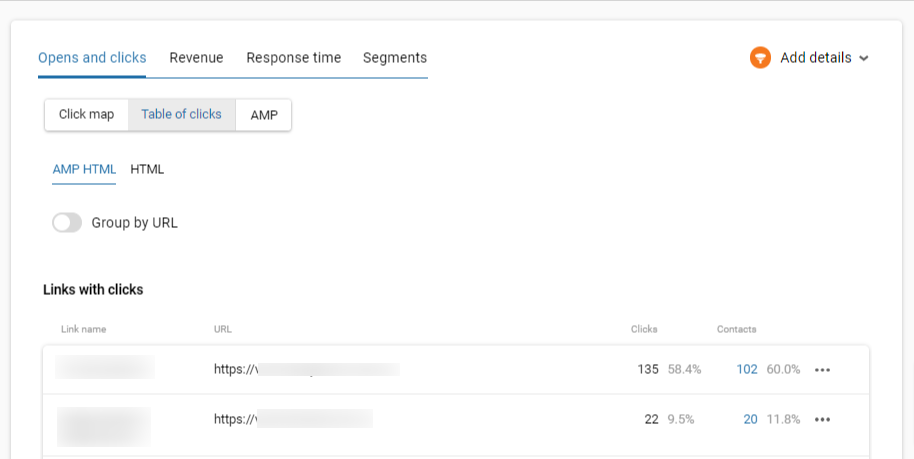
You can upload contacts that clicked on a specific link.
The discrepancy between the numbers in the Clicks and Contacts columns indicates that some users clicked on the same link several times.
The Group by URL switch combines the same links that are found in the email under different elements.
4.1.3 AMP
Option 1. If the email is without AMP content, the report will show the domains and the number of domains with and without AMP support.
Option 2. If the email contains AMP content, the report will show the statistics on its HTML and AMP versions.
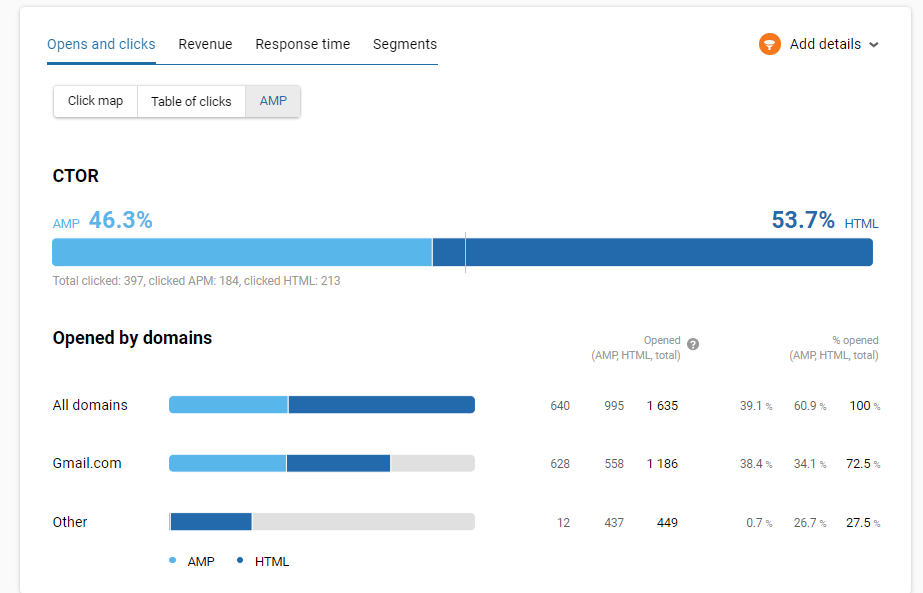
Read more about AMP campaign report>
4.2. Revenue
You can evaluate the financial campaign results if you set up integration with a CRM system that records order data.
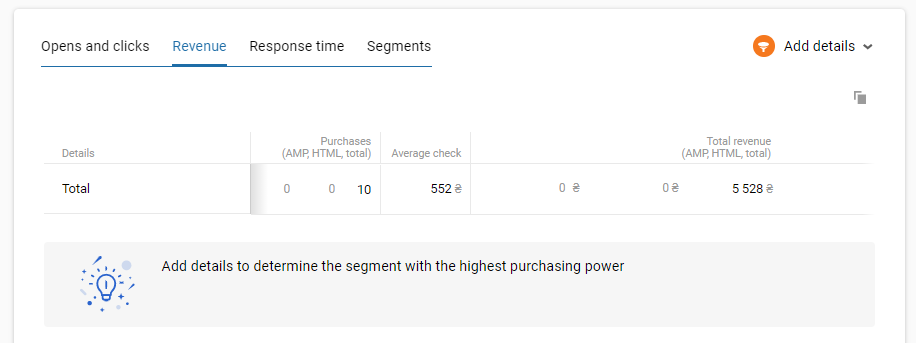
The visualization of campaign revenue is displayed by 3 indicators: the number of purchases, the average check, and the total revenue.
Also, you can view detailed information about purchases from the campaign by each segment you create in your Yespo account.
4.3. Response time
Shows for periods of 24 hours or 7 days the statistics of activity in the email by the hour.
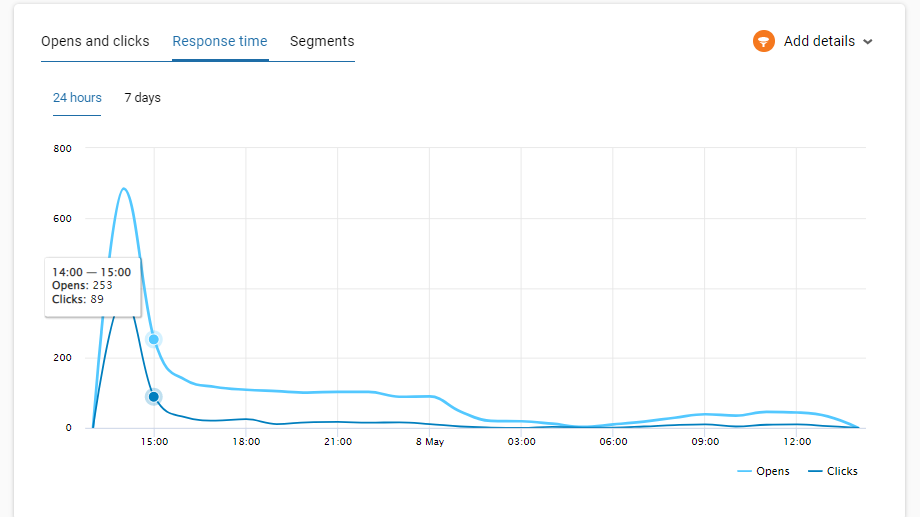
You can see when your campaigns receive a response per day or week. If you regularly send emails during the day, your open rate will be highest in the first 2 hours.
If the email contains AMP elements, you can see the response time by selecting the AMP HTML tab:
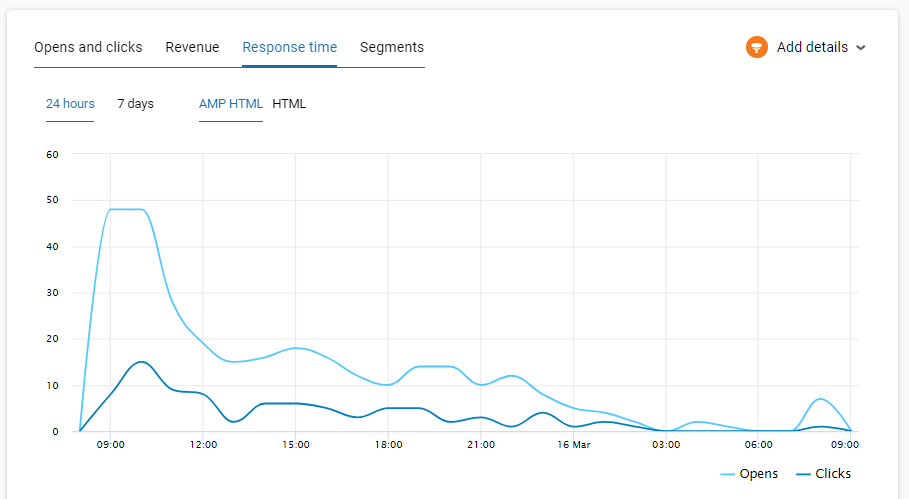
NoteThe overall Opened figure shown elsewhere in this report (see 2. Email Statistics) is deduplicated — each contact counts once, regardless of how many times they opened the message. This Response time graph counts every open event, including repeat opens from the same contact, so its rate can differ from the summary figure shown there.
4.4. Segments
Segments section could contain such tabs:
- Domains
- Platforms and OS
- Device languages
- Multilanguage
- Strategy (optional)
- Segments
4.4.1. Domains
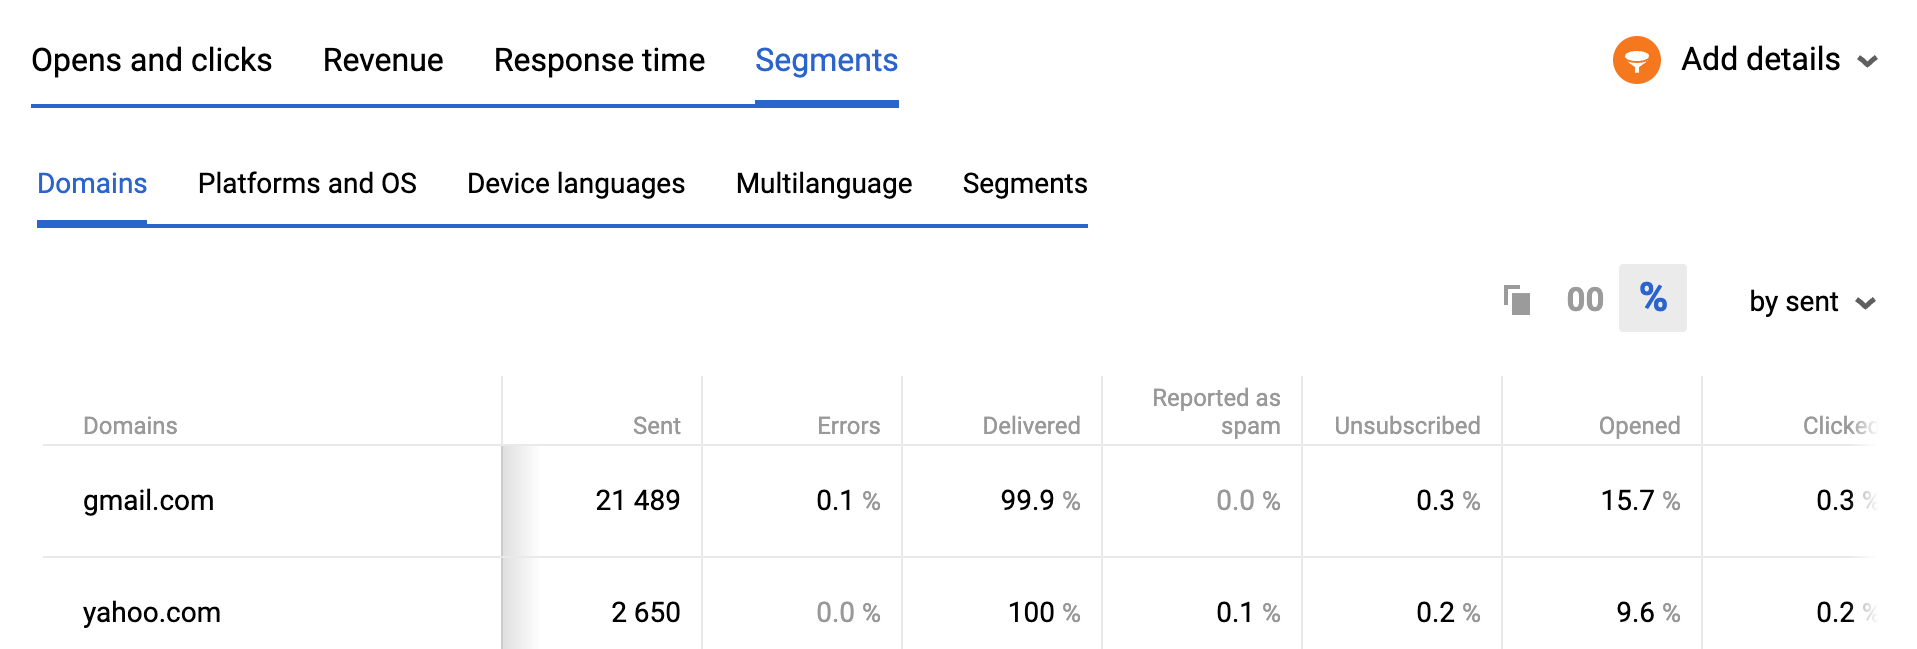
The report provides statistics on the emails by email domains. It shows the deliverability by individual email domains, and allows to indirectly evaluate the probability of your campaign being landed in Spam.
4.4.2. Platforms and OS
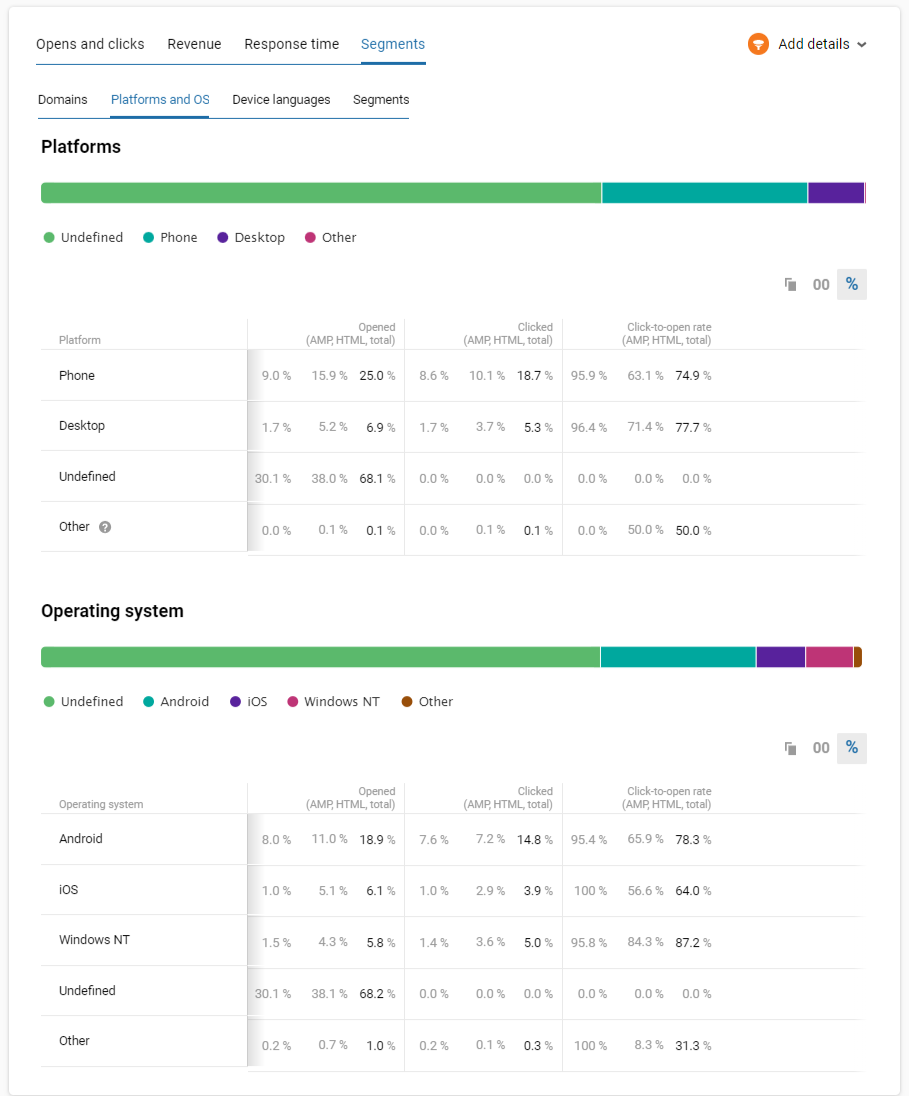
In the Platforms and OS tab, you can view statistics on opened, clicked messages, and click-to-open rates by users' platforms and OS.
The platform and OS are determined from what the mail program reports about itself when it loads images from the email. If the email is opened through a proxy — most often Gmail's image proxy — that data isn't available, and the open falls into the undefined group. So the share of undefined depends on the mail clients your audience uses rather than on the campaign settings.
4.4.3. Device languages
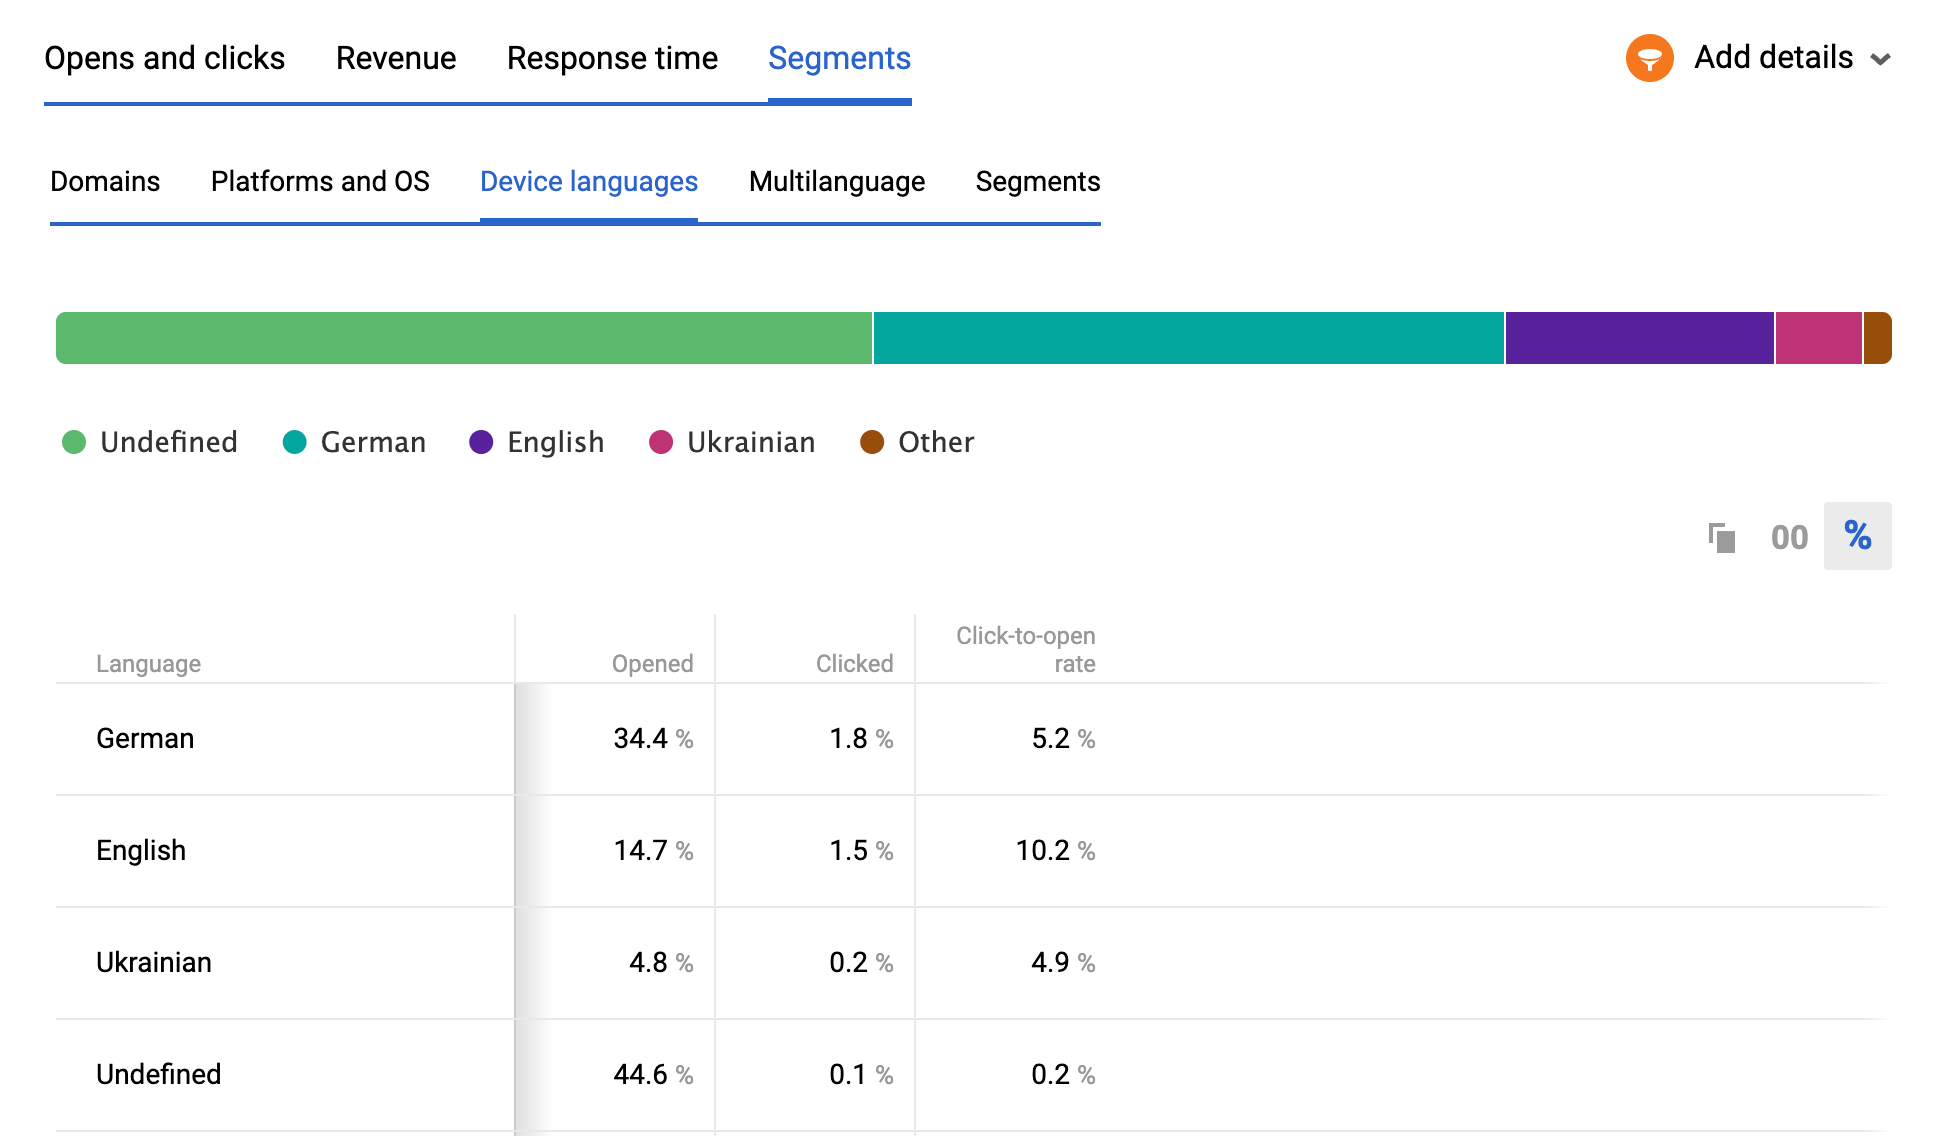
Statistics on campaign recipients' device languages:
4.4.4. Multilanguage
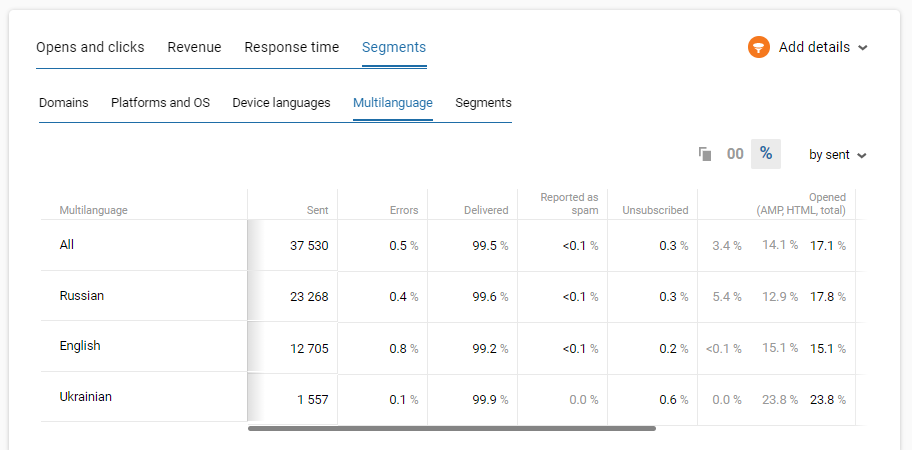
Here you can view campaign results by its language versions.
4.4.5. Strategy
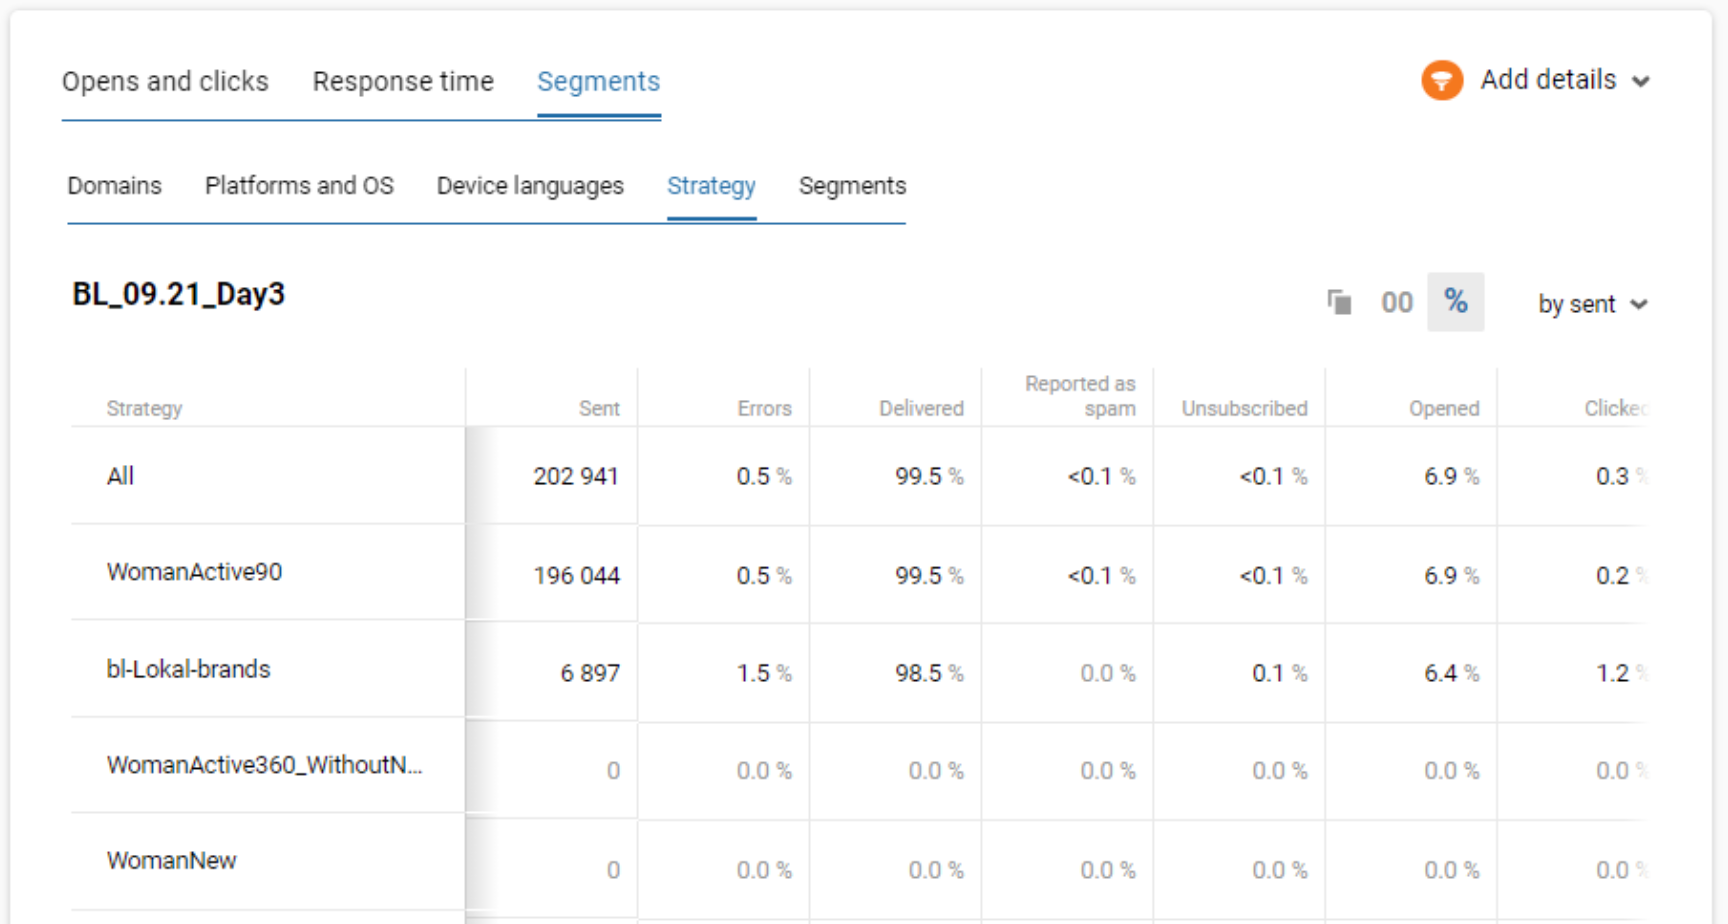
If you have applied a frequency strategy to your campaign, you can see all the data and statistics for each segment from the strategy.
4.4.6. Segments
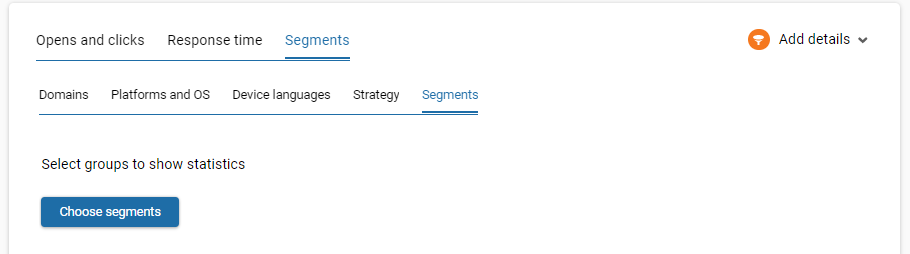
In the Segments -> Segments tab, you can choose specific segments to view their statistics.
4.5. Experiments
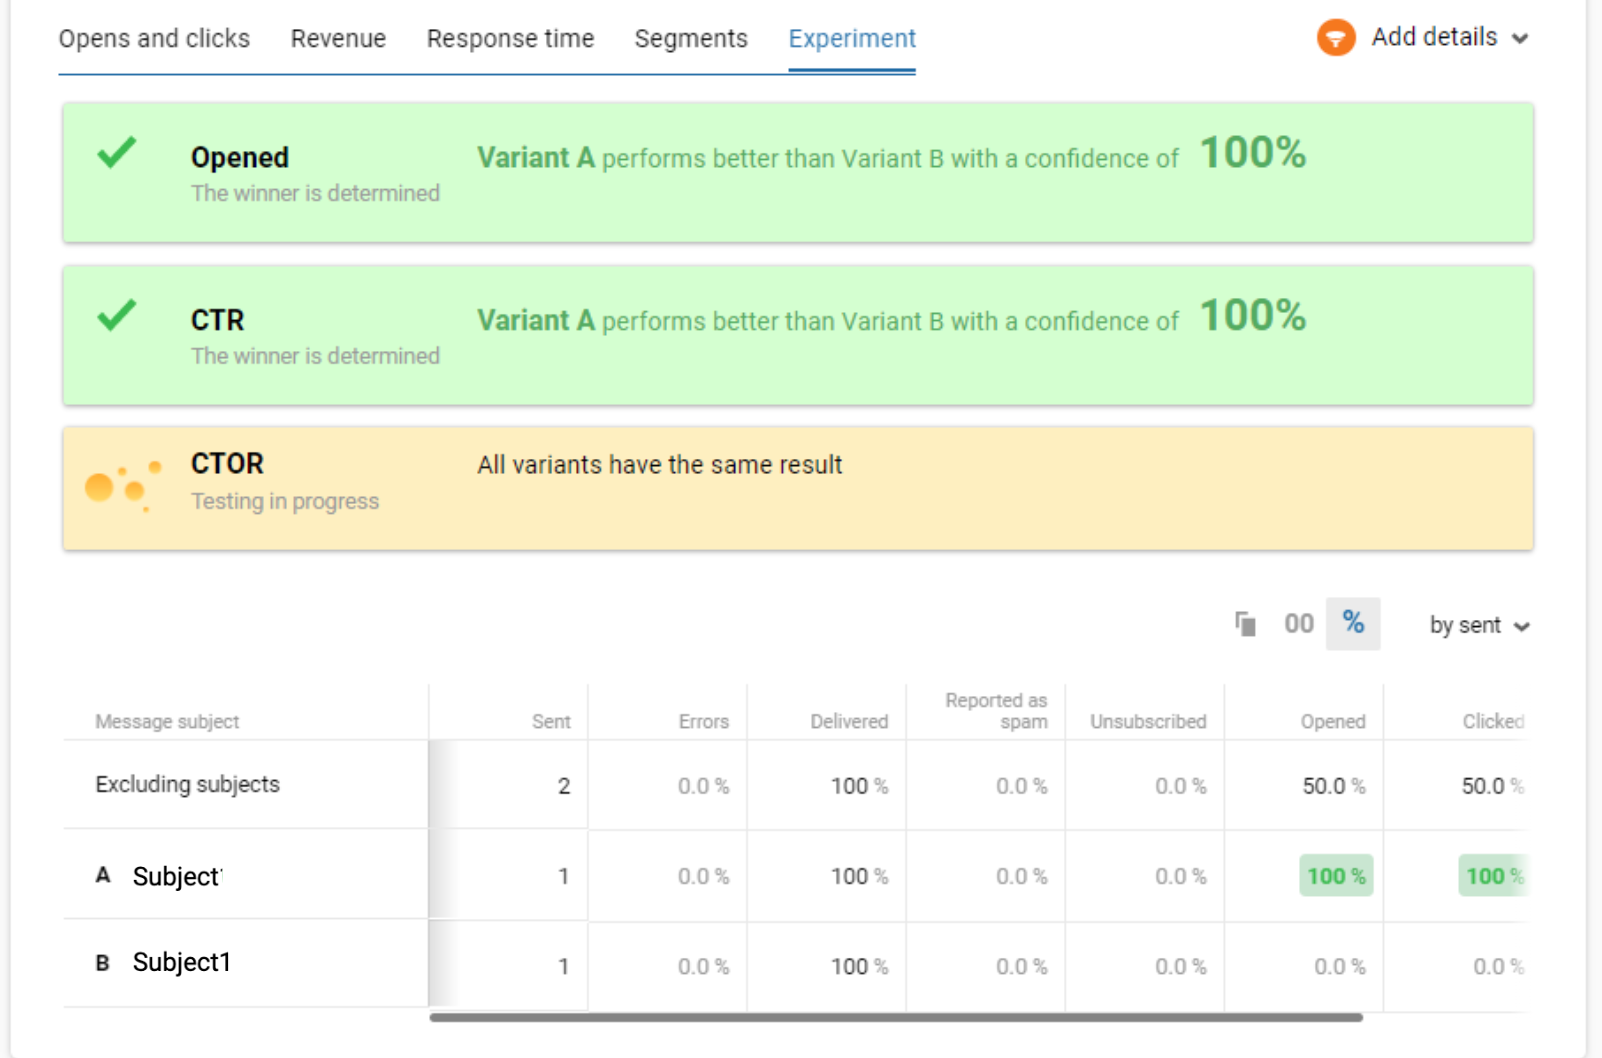
The tab will appear if you have tested subjects for the campaign. Here you can evaluate the results of the A / B test for each version of the email.
Add details dropdown
In the upper right corner in the Add details dropdown, you can select the details of campaign for any tab by parameters:
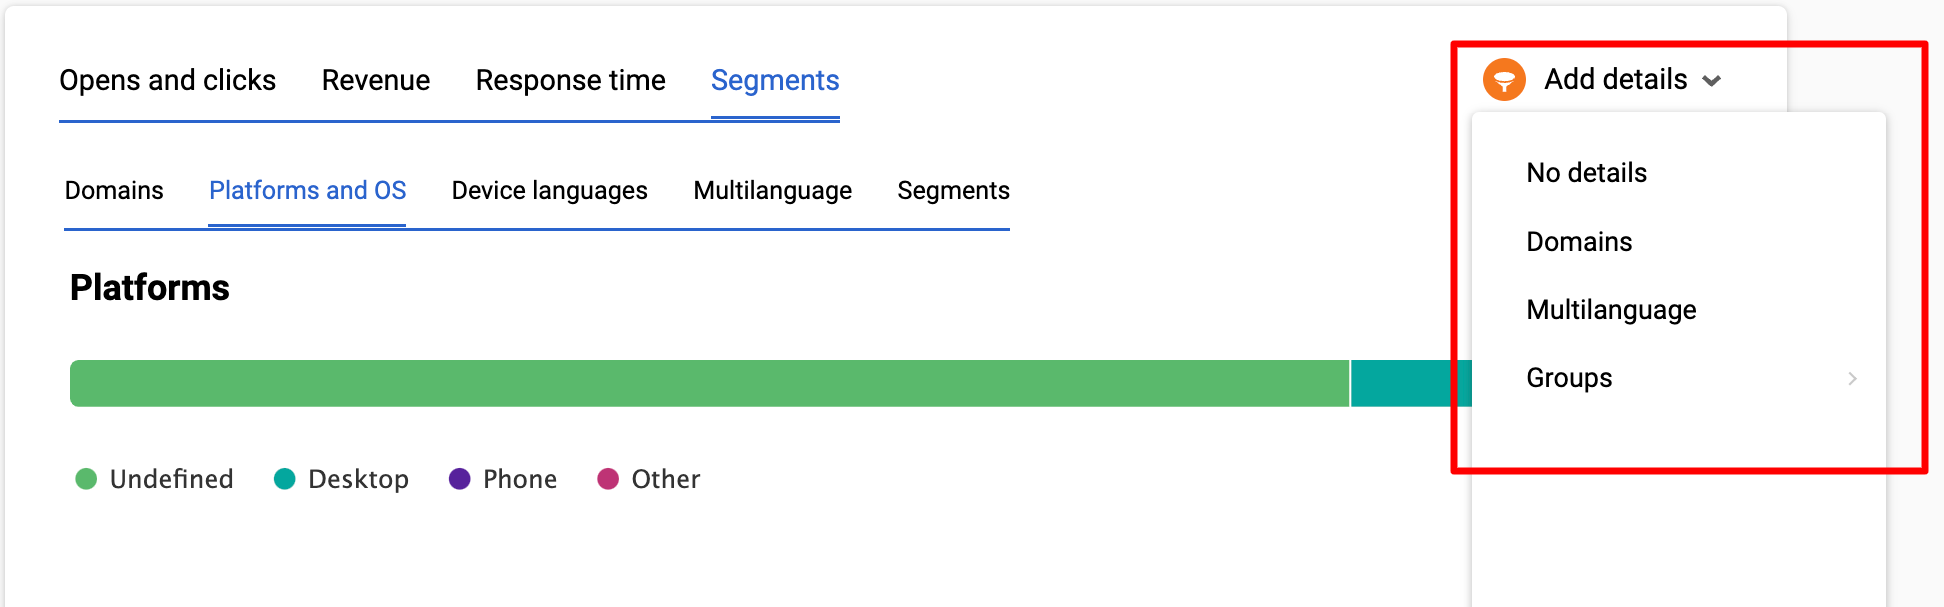
- Domains - statistics by domains.
- Multilanguage - if you send multilingual messages, statistics will be displayed separately for each language version of the message.
- Strategy - statistics by segments from strategy.
- By groups — Initially, statistics for all contacts are displayed, but you can select individual segments and view statistics only for them by clicking on the filter.
Special icons
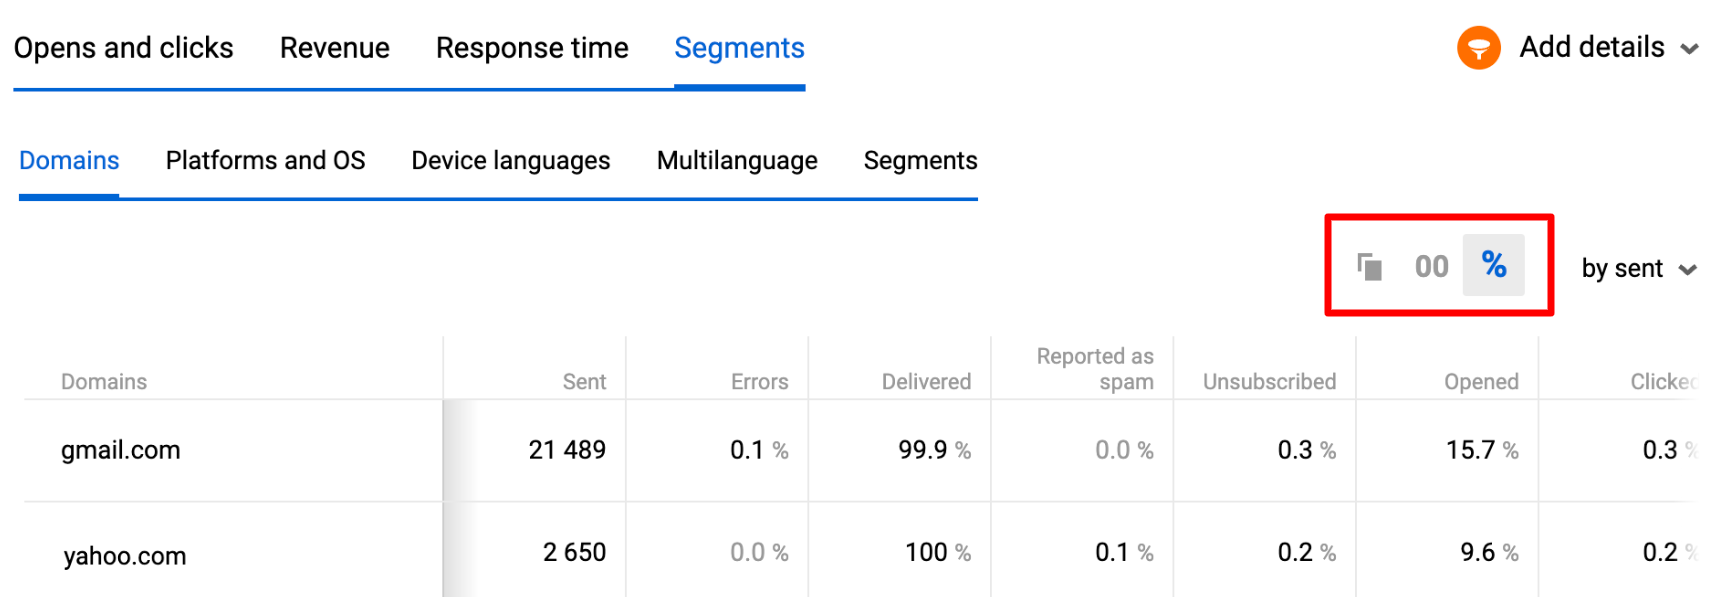
- The copy icon will help you quickly paste data into Excel or Google Sheets.
- The percent icon shows the data as a percentage.
- Icon 00 shows statistics in numbers.
Updated about 1 month ago